Start with 3 Key Metrics for Successful Web Application Performance - NBA Edition Part 1
In Part 1 of this 3-part blog series, I talk about using WebPageTest to look into why my favorite NBA team's website – the New York Knicks – is slow at times. I talked about the first metric you need to look at when running such testing – the number of HTTP requests.
In Part 2, I talk about the second metric ...
Metric #2: Number of Bytes Transferred
According to HTTP Archive, a repository of the performance of the world's top websites, the size of the average website across the globe is actually going up. While Internet speeds are going up as well, a heavier website with more data to send is not a good trend.
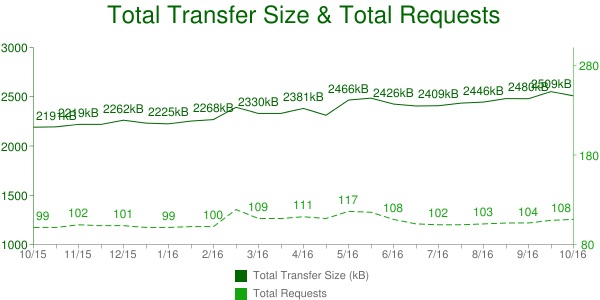
As of October 15, 2016, the average size of the top websites is about 2.5MB, compared to about 2.2MB a year earlier – an increase of more than 10%.
The heavier the website or web application, the more the client has to process. You want to keep processing time down as much as you can.
The reason for these heavier websites is due to the size of the images being used, and to some degree the rapid increased use of video, compared to years past. We humans are very visual. Displaying images can help convey a message much more clearly when accompanied by an image. And in the days of Netflix and YouTube, people are accustomed to consuming a lot of video online.
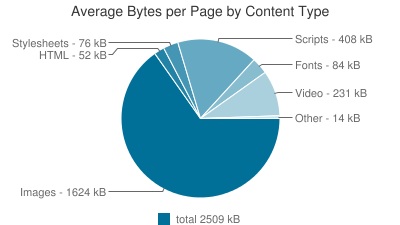
According to HTTP Archive, images make up almost 65% of all bytes of data on an average web page.
In my test of the Knicks website, I get similar results – about 60% of the amount of data that was downloaded are images.
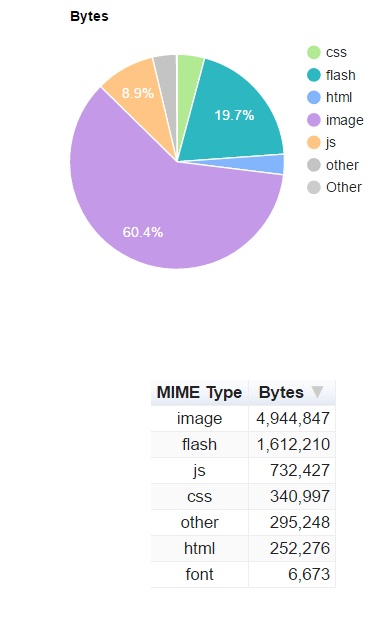
If you add up all those bytes, you get something around 8MB that was transferred to the WebPageTest machine. That's more than 3x the average website monitored on HTTP Archive!
During the test, this was over both a 20Mbps FIOS connection and a 1.5Mbps DSL connection.
Clearly, not every connection is made the same. Some companies have customers from all over the world. Some have fast Internet connections, while others have really slow ones, especially if they're on mobile.
I live in the US, and my Internet provider can only give me DSL. Others in the United States have FIOS and Cable connections that are much faster. So a heavy site, like the Knicks website, is bound to be a performance problem for me and others like me.
This was clearly evident when I tested the site with FIOS and compared it to one with DSL. The difference was almost a 7x response time increase over DSL to FIOS.
Not good for me!
What can be done about that?
Compress and Conquer
Most web server software – by default – allow for the compression of files before sending them to clients. If your server is not doing this, you should enable it. When this is enabled, the amount of the data size sent to the client is reduced.
However, in order for this to occur, both sides have to be able to support compression. It is quite common these days to find that the client browser supports compression, but the server either does not support it or it is not enabled.
All of the top web servers, like Apache HTTP Server, Nginx, Microsoft IIS and others, support compression, so there's really little reason not to enable it.

In my test of the Knicks site, only 58% of the text from the site is compressed. This is a missed opportunity to reduce the amount of data the server sends to the browser by about 585 KB.

For images, only 49% of the total image size is compressed. That means some 51% of the size of images is being transferred across the network at full size. This is another missed opportunity.
In the NBA, 49% is a decent percentage for shooting field goals. Knicks star Carmelo Anthony shoots about 45% for his career, and he's considered a good shooter.
But not with web performance. 49% is bad! There's a lot of room for performance improvements.
So compression should always be enabled if the server supports it.
No Send
Just like the number of requests, you can reduce the amount of data sent by doing one thing – not sending it. Caching can be utilized here as well.
For new users, they can get a compressed file when the request is made. When those users return, their client application won't need to make the request again, thereby avoiding having to download this file again. Instead it pulls it from its local cache.
Also, you can use the HTTP Expires header and/or Cache-Control: max-age.

According to the WebPageTest results of my test of the Knicks site, only 8% of static text and image requests are being cached consistently. In the test, the HTTP cache headers for many of the requests are either fairly short or they don't exist. This means that the next time a request for these text and image files is needed, the browser will make an HTTP request to find out whether the file it has is still valid. If the file is still valid, the server's response should be an HTTP 304 Not Modified response.
While some time may have been saved by the server not having to process and transfer the file, it's still time spent across the network for the client to make the request.
The solution would be to utilize the cache headers so that they contain dates far enough into the future, thereby helping reduce the number of bytes transferred to the user's browser and avoiding an additional round trip altogether.
Image Reduction
As you saw when looking at the HTTP Archive summary of the websites that it monitors, the bulk of the size of an average website is the images, with about 65% of the total transferred size. Some of these image files can be quite big.
Some sites are not using the best image format like JPEG. Many are using PNG and GIF. There can obviously be good reasons for using these formats. Some images look better with PNG when compared to JPEG or vice versa.
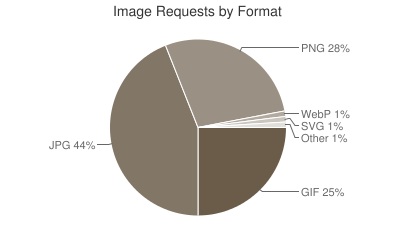
According to HTTP Archive, while JPEG makes up for 44% of images, PNG and GIF together make up a total of 53% of all image formats used by the top websites.
Depending on the type of image, and whether it looks acceptable with some lost quality, there's an opportunity to convert PNG and GIF images to JPEG instead.
Look at the difference between this image I found for all three formats ...

Photo credit: Jeanotderivative work
Can you see the difference? Probably not by a lot, if at all. But look at the file size difference between PNG and JPEG. An 81% reduction in size!
On the Knicks site, one of the biggest images they have is a PNG of Kristaps Porzingis. It's big – with a dimension of 760x442 – and a size of 427 KB. Converting that file to JPEG makes it 68KB. That's a 84% reduction in size! That's a lot less data being sent over the visitor's network connection.
Read 3 Key Metrics for Successful Web Application Performance - NBA Edition Part 3, the final blog of the series, where I finish up with the most important metric of all – the one visitors care about – response time.

The Latest
In MEAN TIME TO INSIGHT Episode 5, Shamus McGillicuddy, VP of Research, Network Infrastructure and Operations, at EMA discusses the network source of truth ...

A vast majority (89%) of organizations have rapidly expanded their technology in the past few years and three quarters (76%) say it's brought with it increased "chaos" that they have to manage, according to Situation Report 2024: Managing Technology Chaos from Software AG ...
In 2024 the number one challenge facing IT teams is a lack of skilled workers, and many are turning to automation as an answer, according to IT Trends: 2024 Industry Report ...
Organizations are continuing to embrace multicloud environments and cloud-native architectures to enable rapid transformation and deliver secure innovation. However, despite the speed, scale, and agility enabled by these modern cloud ecosystems, organizations are struggling to manage the explosion of data they create, according to The state of observability 2024: Overcoming complexity through AI-driven analytics and automation strategies, a report from Dynatrace ...
Organizations recognize the value of observability, but only 10% of them are actually practicing full observability of their applications and infrastructure. This is among the key findings from the recently completed Logz.io 2024 Observability Pulse Survey and Report ...
Businesses must adopt a comprehensive Internet Performance Monitoring (IPM) strategy, says Enterprise Management Associates (EMA), a leading IT analyst research firm. This strategy is crucial to bridge the significant observability gap within today's complex IT infrastructures. The recommendation is particularly timely, given that 99% of enterprises are expanding their use of the Internet as a primary connectivity conduit while facing challenges due to the inefficiency of multiple, disjointed monitoring tools, according to Modern Enterprises Must Boost Observability with Internet Performance Monitoring, a new report from EMA and Catchpoint ...
Choosing the right approach is critical with cloud monitoring in hybrid environments. Otherwise, you may drive up costs with features you don’t need and risk diminishing the visibility of your on-premises IT ...
Consumers ranked the marketing strategies and missteps that most significantly impact brand trust, which 73% say is their biggest motivator to share first-party data, according to The Rules of the Marketing Game, a 2023 report from Pantheon ...
Digital experience monitoring is the practice of monitoring and analyzing the complete digital user journey of your applications, websites, APIs, and other digital services. It involves tracking the performance of your web application from the perspective of the end user, providing detailed insights on user experience, app performance, and customer satisfaction ...


