This blog is an excerpt from DevOps, DBAs, and DBaaS by Mike Cuppet.
End-to-End Response Time
Network packet collectors such as Netmon or Wireshark capture network traffic and provide information about when a request was sent until the response was received — from the network perspective as the capture is taken at the computer's network interface. The gap is the presentation layer, the processing that happens between the browser and the network on the computer. For that, using a product such as Fiddler, HttpWatch, or the Inspect function in certain browsers provide the truest timings.
Combining a packet capture and a browser-level timing makes determining slowness on the user's computer relatively easy, although only a very minute percentage of application performance problems happen at the local computer. But just because multiple users have reported slowness, you should not disregard the client infrastructure. Many companies distribute the same image to many computers, which allows for the possibility that a client-side change has caused a problem. Figure 6-3 demonstrates a packet capture, showing packet sequence, time elements, and packet descriptions.
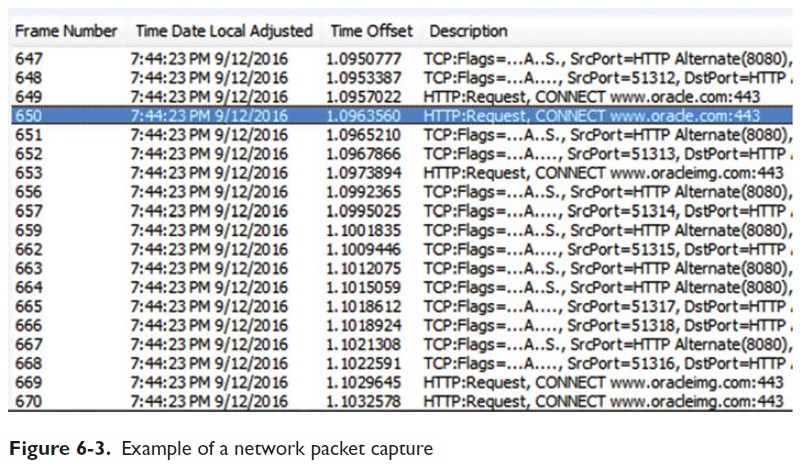
Note: The packet capture can be analyzed further to determine transaction times.
Figure 6-4 shows a proxy capture using HttpWatch . Notice the http calls, execution duration bars, and time data.
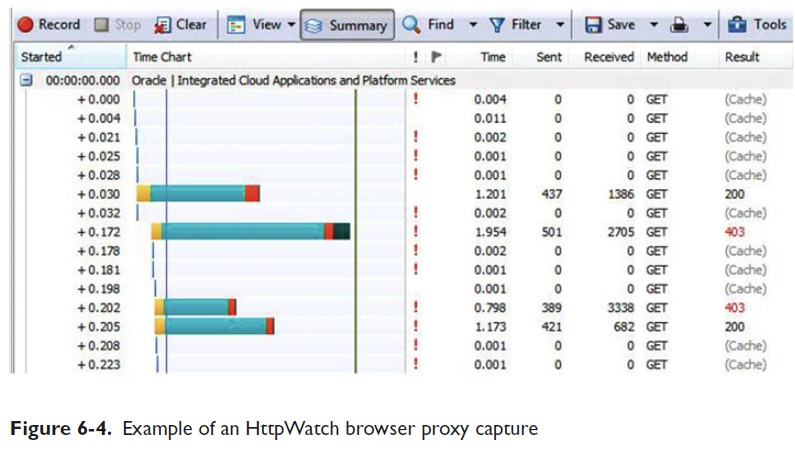
The duration bars make it easy to see which calls take the most time. Imagine the example data being from your application with timings ten times as high. Improving application performance with just this information is possible by investigating each long bar http call.
Figure 6-5 was captured using the browser's Inspect tool , which is accessed by right-clicking the web page in a location without links (a blank space).
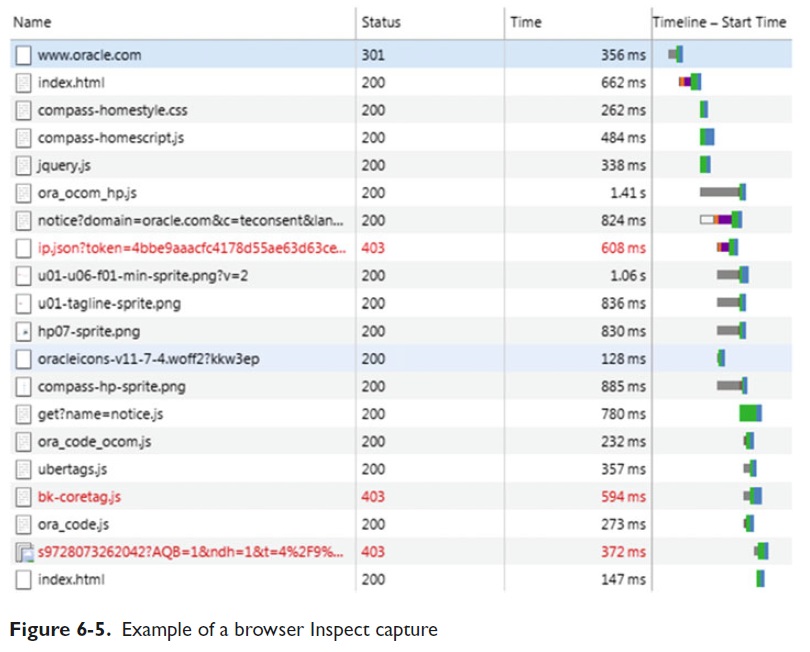
Note Again: The long statement durations have to be investigated further for potential performance enhancements.
Similar analysis should be done as part of the DevOps pipeline to hunt and kill performance-draining beasts. As code is tested in the pipeline against the development and integration ecosystems, collecting performance data sets enables a deep analysis of each code statement's impact on performance. Obviously, statements found violating predetermined baseline performance values must be tuned prior to production release.
Although I simply collected data using a browser call to www.oracle.com to provide simple examples, code performance analysis may require including code within the application that captures performance information or start and stop times for each execution. By now, you may realize that the types and count of the possible checks are vast; your goal is to determine which checks, done where, bring the best results.
The infrastructure example exists in real life because customers visiting the company web site expect great response times. What happens behind the curtain is the DevOps team's responsibility to deliver. If the application reaches out for credit card authorization or to validate the visitor's membership needed for a discount, that time needs to be analyzed before and after changes are made.
As shown, digging out exact timings provides a much better understanding of the application performance — broken into manageable chunks for analysis and correction.
Read Optimizing Application Performance with Change Management Improvements - Part 2
The Latest
While most companies are now deploying cloud-based technologies, the 2024 Secure Cloud Networking Field Report from Aviatrix found that there is a silent struggle to maximize value from those investments. Many of the challenges organizations have faced over the past several years have evolved, but continue today ...
In our latest research, Cisco's The App Attention Index 2023: Beware the Application Generation, 62% of consumers report their expectations for digital experiences are far higher than they were two years ago, and 64% state they are less forgiving of poor digital services than they were just 12 months ago ...
In MEAN TIME TO INSIGHT Episode 5, Shamus McGillicuddy, VP of Research, Network Infrastructure and Operations, at EMA discusses the network source of truth ...

A vast majority (89%) of organizations have rapidly expanded their technology in the past few years and three quarters (76%) say it's brought with it increased "chaos" that they have to manage, according to Situation Report 2024: Managing Technology Chaos from Software AG ...
In 2024 the number one challenge facing IT teams is a lack of skilled workers, and many are turning to automation as an answer, according to IT Trends: 2024 Industry Report ...


