Transforming your monolithic application into a microservices-based one is not as easy as many think. When you are breaking a software down into smaller pieces, you're moving the communication to the network layer and the complexity of your architecture is heavily increasing. Other issues arise as well since performance monitoring and finding the root source of an error becomes extremely challenging.
With the rise of microservices, developers need proper Application Performance Management (APM) tools to develop and operate their applications successfully. This blog examines the particular difficulties of monitoring microservices and what APM should be able to do to alleviate the major pain-points of monitoring and debugging them.
Figuring Out What Breaks in a Microservices Application
In a monolithic application, specific code pieces are communicating in the applications memory. It means that when something breaks, the log files will probably be useful to find the cause of an error and you can start debugging right away.
When something goes wrong in a microservices call-chain – called distributed transactions – all of the services participating in that request will throw back an error. It means that you need an excellent logging system, and if you have one, you'll still experience problems since you have to manually correlate the log files to find out what caused the trouble in the first place.
What's the solution to this problem? Distributed Tracing.
For microservices applications, there is a much more sophisticated application performance monitoring method available, called Distributed Tracing.
For distributed tracing, you have to attach a correlation ID to your requests which you can use to track what services are communicating with each other. With these IDs, you can to reverse engineer what happened during an error since all of the services involved in a request will be there for you to see instantly.
Next-gen APM solutions can already attach correlation IDs to requests and can also group the services taking part in a transaction and visualize the exact dataflow on a simple tree-graph. A tool like this enables you to see the distributed call stacks, the root cause of an error, and the dependencies between your microservices.
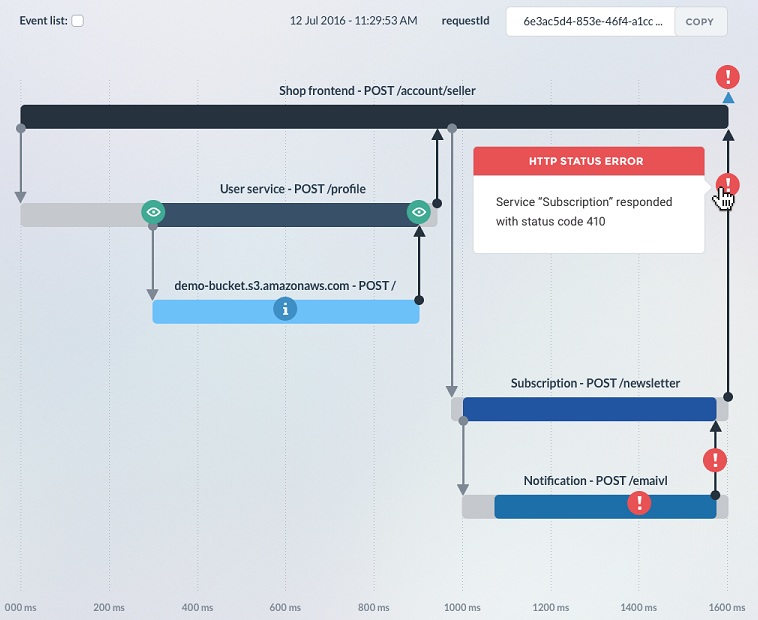
A distributed tracing timeline shows all of the services taking part in a certain transaction and the source of the error that later propagated back to all of them
There are only a few Distributed Tracing solutions available right now, but you can find open source solutions for Java monitoring and a SaaS solution focusing on Node.js – the technology primarily used for building microservices.
The concept of Distributed Tracing is based on Google’s Dapper whitepaper, which is publicly available here.
Increasing Architecture Complexity and Slow Response Times
As I mentioned above, increasing architecture complexity comes by the definition with microservices.
In a microservices application, the services will usually use a transport layer, like the HTTP protocol, RabbitMQ or Kafka. It will add delays to the internal communication of your application, and when you put services into a call chain, your response times will be higher. A modern APM solution must be prepared for this, and support message queue communication to map out a distributed system. If you have one, you'll be able to figure out what makes it slow.
Companies that build microservices should be able to deal with slow response times by using a distributed tracing APM tool. Correlation IDs let you visualize whole call chains and look for slow response times, whether it's caused by a slow service or the slow network.
If the transaction timeline graph shows that your services are fine, but your network is slow, you can to speed up your application by investigating that. One time, we could figure out that our PaaS provider was using external routing, so every request between our services went outside the public network and back, it reached more than 30 network hops, which caused the bad response time. The next step, in this case, was to choose another without external routing.
If your network times are fine, you have to investigate what slows your services down. It's quite easy if you have an APM with a built-in CPU profiler, or you have some profiling solution enabled. Requesting a CPU profile in the right time (presumably when the response time of a service gets high) will allow you to look for the slow functions and find the location of them. Thankfully, Chrome's Developer Tools support loading and analyzing javascript CPU profiles which solves this problem.
Conclusion
Application performance monitoring solutions have been around for a while, offering the same functionalities for years without major breakthroughs. This has to change. The way how we develop and deploy software is not the same than it was three years ago, and legacy APM tools are not helping as much as they used to. We need solutions that are treating microservices as first class citizens, and the developers who are building them too.
Gergely Nemeth is Co-Founder and CEO of RisingStack.