The use of hybrid multicloud models is forecasted to double over the next one to three years as IT decision makers are facing new pressures to modernize IT infrastructures because of drivers like AI, security, and sustainability, according to the Enterprise Cloud Index (ECI) report from Nutanix ...

Over the last 20 years Digital Employee Experience has become a necessity for companies committed to digital transformation and improving IT experiences. In fact, by 2025, more than 50% of IT organizations will use digital employee experience to prioritize and measure digital initiative success ...
While most companies are now deploying cloud-based technologies, the 2024 Secure Cloud Networking Field Report from Aviatrix found that there is a silent struggle to maximize value from those investments. Many of the challenges organizations have faced over the past several years have evolved, but continue today ...
In our latest research, Cisco's The App Attention Index 2023: Beware the Application Generation, 62% of consumers report their expectations for digital experiences are far higher than they were two years ago, and 64% state they are less forgiving of poor digital services than they were just 12 months ago ...
In MEAN TIME TO INSIGHT Episode 5, Shamus McGillicuddy, VP of Research, Network Infrastructure and Operations, at EMA discusses the network source of truth ...

A majority (89%) of organizations have rapidly expanded their technology in the past few years and three quarters (76%) say it's brought with it increased "chaos" that they have to manage, according to Situation Report 2024: Managing Technology Chaos ...

In 2024 the number one challenge facing IT teams is a lack of skilled workers, and many are turning to automation as an answer, according to IT Trends: 2024 Industry Report ...
Organizations are continuing to embrace multicloud environments and cloud-native architectures to enable rapid transformation and deliver secure innovation. However, despite the speed, scale, and agility enabled by these modern cloud ecosystems, organizations are struggling to manage the explosion of data they create, according to The state of observability 2024: Overcoming complexity through AI-driven analytics and automation strategies, a report from Dynatrace ...

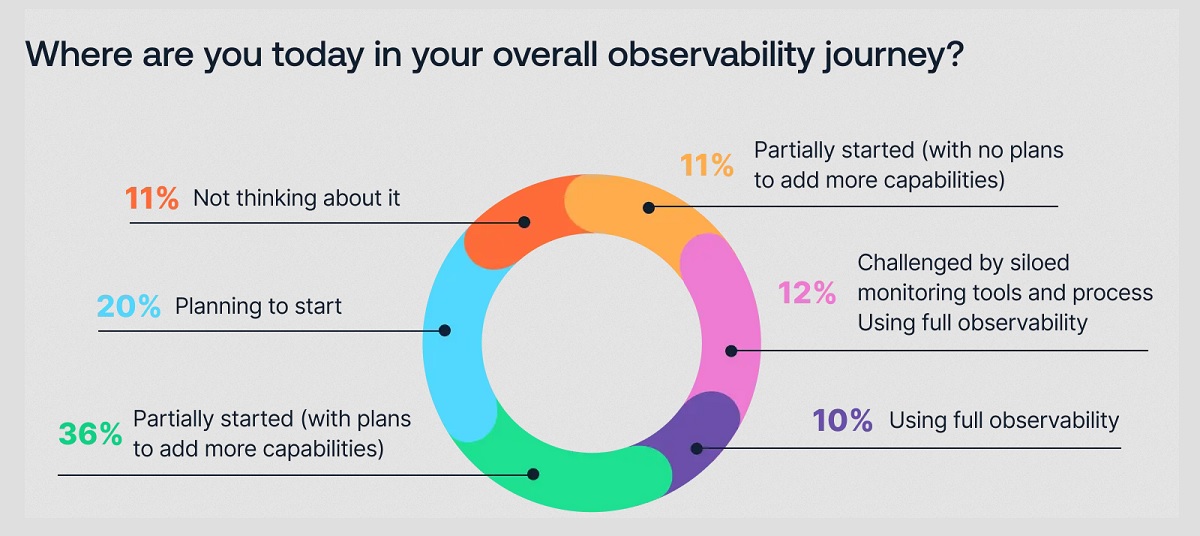
Organizations recognize the value of observability, but only 10% of them are actually practicing full observability of their applications and infrastructure. This is among the key findings from the recently completed Logz.io 2024 Observability Pulse Survey and Report ...
Businesses must adopt a comprehensive Internet Performance Monitoring (IPM) strategy, says Enterprise Management Associates (EMA), a leading IT analyst research firm. This strategy is crucial to bridge the significant observability gap within today's complex IT infrastructures. The recommendation is particularly timely, given that 99% of enterprises are expanding their use of the Internet as a primary connectivity conduit while facing challenges due to the inefficiency of multiple, disjointed monitoring tools, according to Modern Enterprises Must Boost Observability with Internet Performance Monitoring, a new report from EMA and Catchpoint ...

Choosing the right approach is critical with cloud monitoring in hybrid environments. Otherwise, you may drive up costs with features you don’t need and risk diminishing the visibility of your on-premises IT ...
Consumers ranked the marketing strategies and missteps that most significantly impact brand trust, which 73% say is their biggest motivator to share first-party data, according to The Rules of the Marketing Game, a 2023 report from Pantheon ...
Digital experience monitoring is the practice of monitoring and analyzing the complete digital user journey of your applications, websites, APIs, and other digital services. It involves tracking the performance of your web application from the perspective of the end user, providing detailed insights on user experience, app performance, and customer satisfaction ...

Modern organizations race to launch their high-quality cloud applications as soon as possible. On the other hand, time to market also plays an essential role in determining the application's success. However, without effective testing, it's hard to be confident in the final product ...

Enterprises are experiencing a 13% year-over-year increase in customer-facing incidents, reflecting rising levels of complexity and risk as businesses drive operational transformation at scale, according to the 2024 State of Digital Operations study from PagerDuty ...
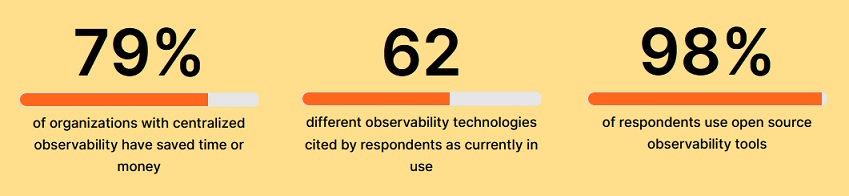
According to Grafana Labs' 2024 Observability Survey, it doesn't matter what industry a company is in or the number of employees they have, the truth is: the more mature their observability practices are, the more time and money they save. From AI to OpenTelemetry — here are four key takeaways from this year's report ...
In an age where technology evolves at a breakneck pace, it's crucial to explore how AI assistants can revolutionize our work processes and daily lives, ultimately enhancing overall performance ...
Nearly all (99%) globa IT decision makers, regardless of region or industry, recognize generative AI's (GenAI) transformative potential to influence change within their organizations, according to The Elastic Generative AI Report ...

Agent-based approaches to real user monitoring (RUM) simply do not work. If you are pitched to install an "agent" in your mobile or web environments, you should run for the hills ...
The world is now all about end-users. This paradigm of focusing on the end-user was simply not true a few years ago, as backend metrics generally revolved around uptime, SLAs, latency, and the like. DevOps teams always pitched and presented the metrics they thought were the most correlated to the end-user experience. But let's be blunt: Unless there was an egregious fire, the correlated metrics were super loose or entirely false ...