Most organizations understand that centralized network monitoring is vital to maintaining the health of critical infrastructure and applications. And while solutions using NetFlow undoubtedly help gain perspective into capacity planning, trend analysis, and utilization, they lack the important precision of packet-based analytics tools that provide root-cause analysis for application performance, latency, TCP/IP or VoIP problems. Both monitoring technologies have their advantages and ideal use cases, so let's see how enterprises can maximize existing infrastructure and equipment investments by using packet analytics to complement NetFlow.
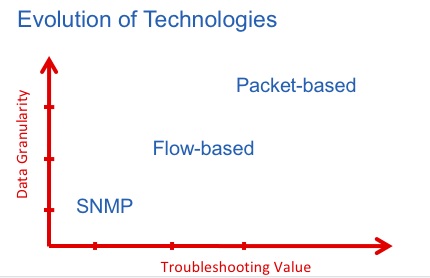
Evolution of Network Monitoring Technologies
First up is NetFlow. This is a well-known, well-established standard that provides conversational information about network status. Compared with even older protocols like SNMP, NetFlow offers greater precision, delivering data at intervals of around 1 second, depending on the equipment being monitored. NetFlow also has the advantage when it comes to providing a good global view of a network. This can be extremely helpful when monitoring the network's general health.
Next, let's turn to packed-based analytics. This breed of network monitoring solution delivers a much higher troubleshooting value to NetOps teams thanks to its data granularity and access to raw data. Since it is packet based, it is very precise, and interval times are often as short as a few nanoseconds. On top of that, the data is completely based on the original payload, so it isn't abbreviated or compiled.
What's the Difference Between Flow- and Packet-Based Analytics?
The key benefit of packet-based solutions is that they can provide much more information that can be used in network diagnostics. If there is a problem, the packet-based approach is completely passive, so it doesn't burden the network or interfere with existing operations or services. As you can imagine, this is very important, especially because nobody wants to exacerbate existing problems by piling on more network traffic.
NetFlow data, which typically comes from Layer 3 devices like routers and firewalls, provides good information about traffic volume between devices. But if you need to use multiple ports, NetFlow is at a disadvantage. This is where packet-based analytics come into their own. Packet analysis allows users to drill down and discover information about how the network is behaving, not just whether it's operating well. All of the packets and all of the information is there in the packets, so it's also going to be 100 percent accurate. And the final advantage is that packet-based analysis can be implemented with very little impact on the network, while supporting monitoring and troubleshooting simultaneously.
When it comes to troubleshooting, Flow-based technology is useful only up to Layer 3 (and occasionally Layer 4) so at least we can see where data traffic is being generated. When the NetOps team starts to get trouble tickets about a slow network or a CRM that's unable to save any records (for example), they need to start looking at the root cause. In this scenario, NetFlow would reveal that traffic is going between the client and the server, and that it's running on a specific port. It could also tell you what volume of traffic is produced by each of the clients. In other words, you could verify simple problems like whether the server is up and running and whether the port is operational.
The key here is that NetFlow alone isn't adequate in a modern network setting. It struggles to identify any activity associated with content delivery networks and applications that use multiple TCP or UDP ports. It also has no visibility into the payload or its contents. You may be able to see that a server has an issue, but that's far from definitive.
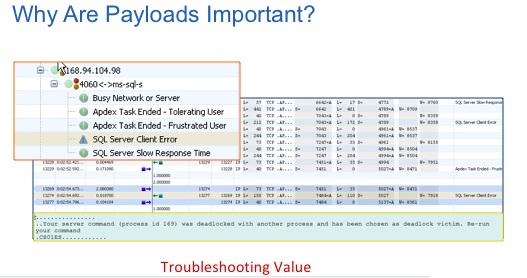
Take a look at the screenshot below, taken from a real use case. In this situation, a client is unable to get a response from a server, and its task is canceled. By investigating the reason for this problem, the packet-based solution quickly identifies the issue and shows the cause. In the text box at the bottom we see a message: “Your server command (process id 169) was deadlocked with another process and has been chosen as deadlock victim. Re-run your command.” This reference code tells us that the error was generated when two tasks concurrently requested access to the same resource. Armed with this information, the network team quickly determines that the problem is with the application, not the network, and provides the application team with actionable data to directly address the issue.
Packet-based analysis has been designed specifically to reveal the “how” of the network. Rather than being about just the volume of traffic, these solutions expose vital details about performance and application response. Users can compare network latency with application latency. They can see the efficiency of TCP communications on their network. They can evaluate the performance of VoIP and video over the network and determine if these real-time protocols are prioritized correctly. None of this can be achieved with NetFlow or its derivatives.
To help make my point, here are five common questions that can be solved when packet-based analysis is used in tandem with Netflow:
■ Is it the network or the application?
■ Is the issue isolated to a single user, a single server, or the network overall?
■ Are critical applications using network resources efficiently?
■ Is my network correctly configured for unified communications, and are unified communications co-existing with other network transactions?
■ Are critical functions, for example user authentication, failing due to protocol issues?
NetFlow certainly has its place in the network monitoring hierarchy, but its limitations make it less than ideal in many situations. For most network professionals, having access to packet data is a no-brainer and significantly accelerates mean-time-to-resolution (MTTR). The challenge is in learning how to balance the way we use these tools in our approach to network monitoring.