Earlier this year, I offered a Performance Clinic for early attendees at STPCon. As part of this, we conducted a performance diagnostic session on a live e-commerce website, and after our first initial glance at their landing page we saw the usual performance suspects – no surprise to me or the members of the company in the room.
The members of the company that I connected with have tried hard over the last few months to highlight these problems to their engineering and business teams, but have repeatedly found their concerns falling on deaf ears. So, one of my goals today is to re-raise awareness for a few very basic Web Performance Optimizations (WPOs). Whether you use browser built-in diagnostics tools or extensions, it doesn’t matter. These tools are available for every developer, web designer and tester and absolutely must be used as a final sanity check before checking on or releasing code.
Some of the highlights we found on the website we analyzed during the performance clinic are below.
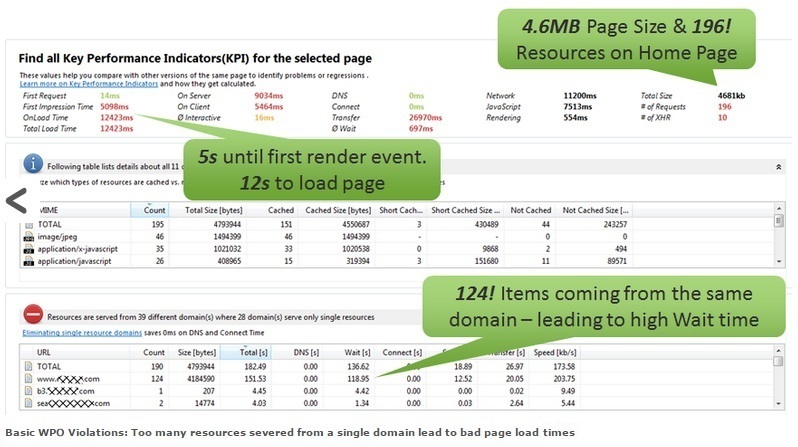
1. Key Metrics: Size, Resources and Load Times
An illustration of our analysis of the e-commerce website is below, making a number of potential improvements quite obvious. There is a basic golden rule of WPO to follow here: reduce roundtrips, reduce content size, leverage CDNs, minimize and merge content, and use proper caching.
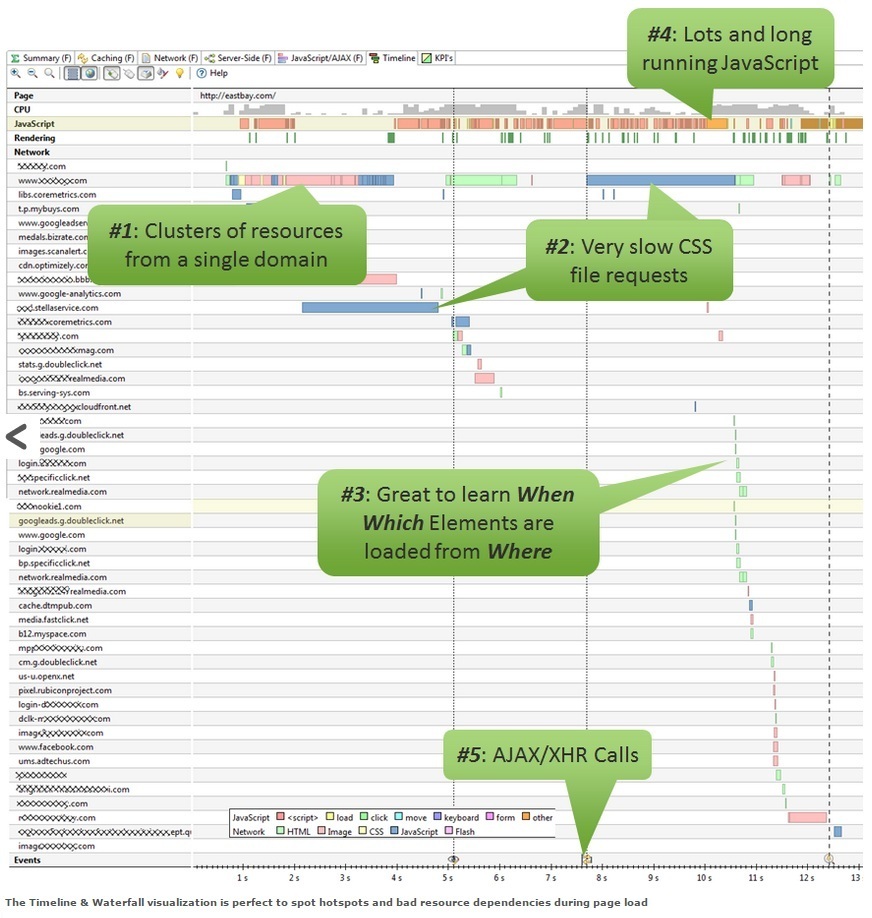
2. Timeline/Waterfall: Learn How Your Pages Are Designed
Just about every WPO tool out there provides a Timeline or Waterfall Chart, and this is quite useful as it’s important to learn how different browsers actually load your page. Which resources are depending on each other? How does JavaScript impact page load? How much rendering is going on? All important questions that need answering. However for me there are always two main focus areas: Network Waterfall and JavaScript Executions. I always try to spot the long running network requests, find “blocks” of network requests coming from the same domain, find visual dependencies between requests as well as looking at long running, and excessive JavaScript execution.
For example:
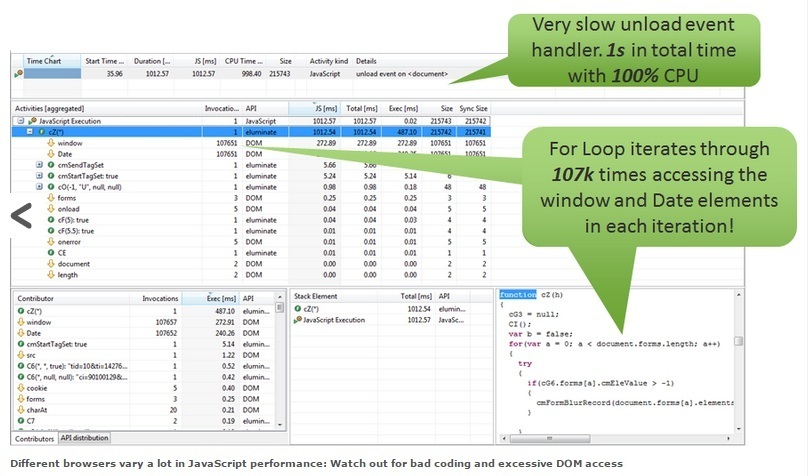
3. JavaScript Hotspots
JavaScript plays a very important role on most websites. You don’t know how powerful your user’s JavaScript engine of choice is going to be, so it is important to optimize your JavaScript in order to provide a good user experience regardless of the browser version, operating system, or underlying hardware. In our case, we found a very inefficient for-loop that iterated 107,000 times in the unload event handler. When somebody navigated from one page to the next this JavaScript code blocked the browser with 100% CPU utilization. That’s something that could easily be optimized.
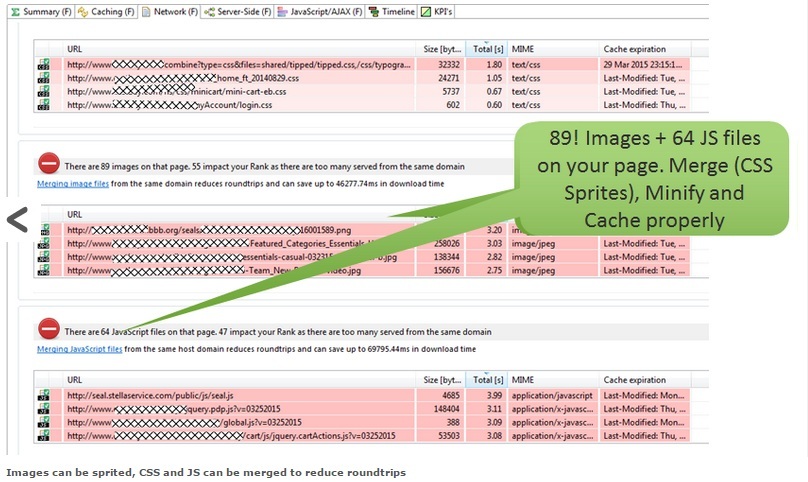
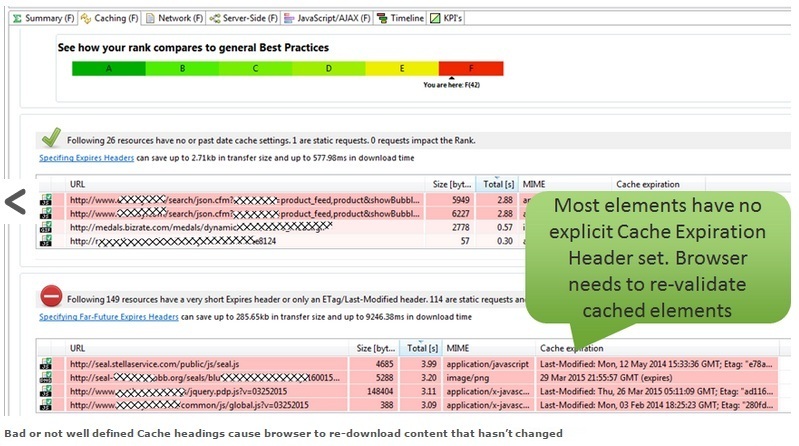
4. Bad Caching and No Merging
Most static content (Images, JavaScript, CSS files) can be cached on the browser so that returning users don’t have to download your company logo, product images or jQuery library every time they visit your page. Another point is merging multiple JavaScript and CSS files together to reduce elements on the page. Both are common techniques to optimize user experience for first time and returning visitors. The screen shots below illustrate the potential ramifications if you don’t cache and merge:
5. Server-Side Performance
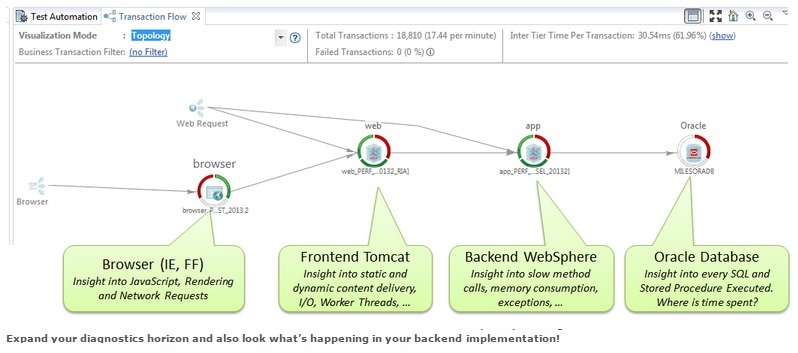
In our Performance Clinic at STPCon we only analyzed the front-end performance of this website, but I soon learned that these guys are also using an APM tool on the server-side and by using such tools they also found “The Classics” on the backend: too many database roundtrips, bad server-side coding, multi-threading issues with blocking resources, etc.
So, this is a shout-out to anyone concerned about performance and user experience - look beyond what’s happening in the browser and use performance management tools to look behind the scenes as well.
Andreas Grabner is Performance Advocate at Dynatrace.
