As hybrid cloud monitoring rises in importance, Red Hat OpenShift Container Platform, a mature Kubernetes-based environment, is becoming a key tool for developing and managing cloud-native applications.
Regardless of OpenShift being a scalable and flexible software, it can be a pain to monitor since complete visibility into the underlying operations is not guaranteed. OpenShift clusters are inherently distributed, with components spread across multiple nodes. This introduces complexities in tracing requests and identifying bottlenecks. The complexity of multi-layered infrastructures and large-scale deployments inevitably leads to blind spots. To maximize the value of platforms like OpenShift, administrators must have clear infrastructure overviews and detailed understanding of key business performance indicators.
To effectively monitor an OpenShift environment, IT administrators should focus on these five key elements and their associated metrics:
1. Nodes
IT admins need to keep an eye on all OpenShift nodes in order to monitor important metrics such as CPU usage, disk space, and memory usage in real-time.
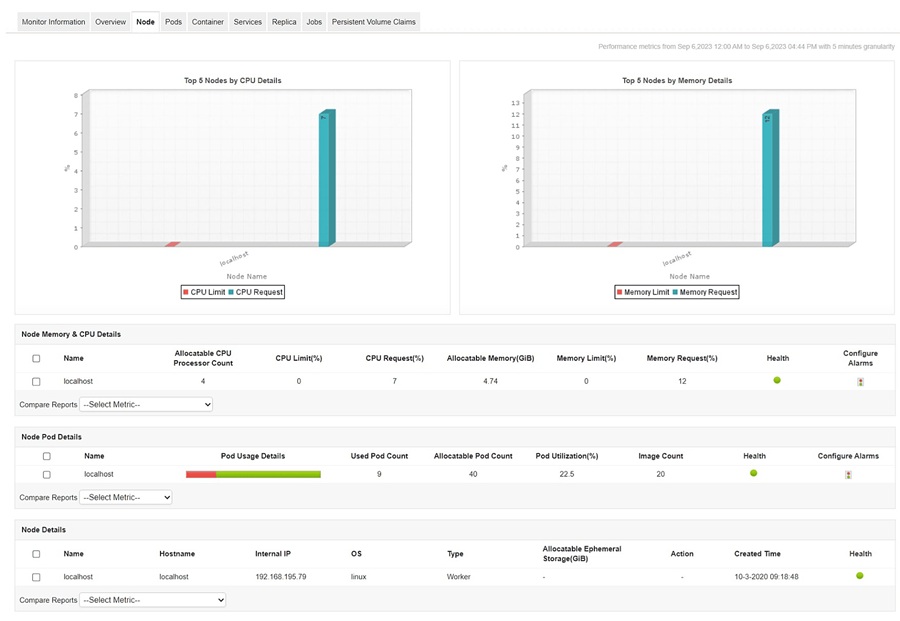
By monitoring OpenShift nodes, administrators gain insights into performance trends and the behavior of the nodes , revealing metric relationships. This comprehensive visibility facilitates accurate forecasting of future trends, and proactively prevent bottlenecks, ensuring smooth traffic flow.
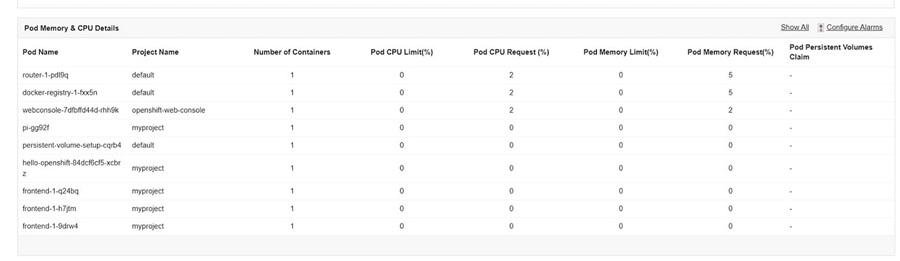
2. Pods
When a pod performing a priority function fails, could result in application downtime, decreased performance, and in extreme cases, a total outage, affecting the application's availability and dependability. And when this happens especially in a complex OpenShift setup, troubleshooting the issue becomes a significant and time-consuming challenge.
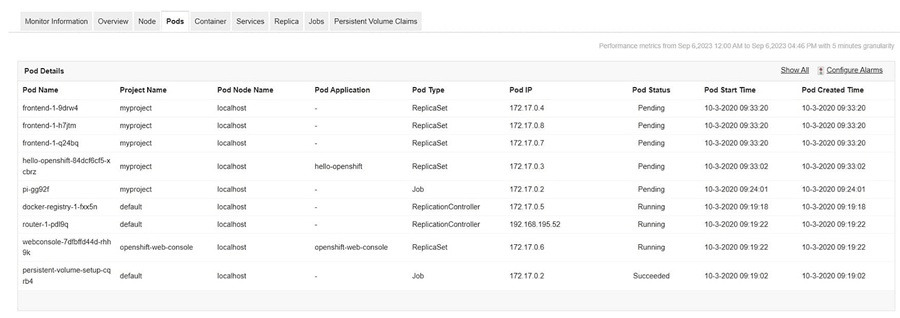
By monitoring each pod in real-time through your OpenShift monitoring tool, you can track key metrics, activity, and resource usage, revealing the root causes behind errors and performance degradation.
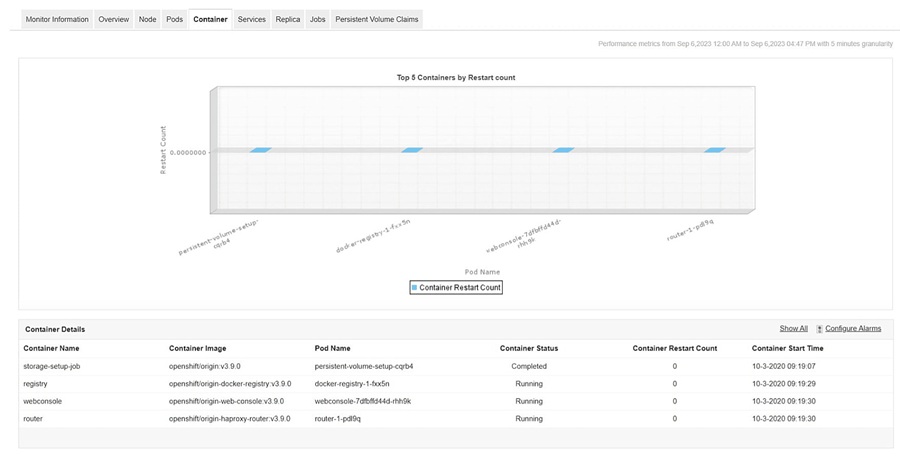
3. Containers
Monitoring container metrics like resource consumption, availability and status is imperative to ensure peak performance of containers. Containers share underlying infrastructure resources. Monitoring CPU, memory, and disk usage allows efficient resource allocation and prevents contention Real-time analysis of these metrics allows administrators to swiftly identify and resolve issues, maintaining optimal user experience.
4. Replication Controller
While largely superseded by ReplicaSets and Deployments, a replication controller's core function is to create and maintain a desired number of running pods. It allows administrators to easily scale, update, or delete pods. Multiple controllers manage different pod sets, ensuring the performance of their respective applications.
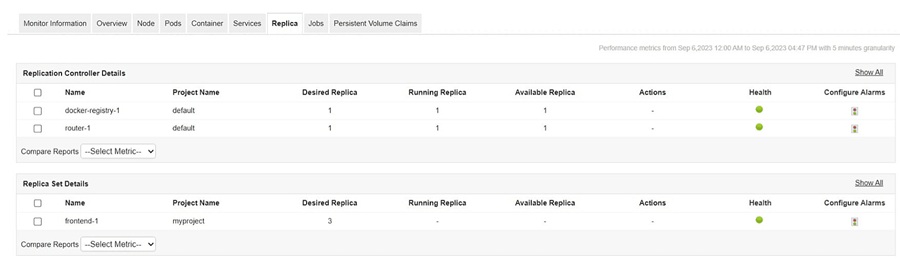
To maintain optimal container performance, it's crucial to monitor replication controllers and their replica counts (desired, running, and available). By keeping an eye on RCs, you can detect and resolve problems such as pod failures or inaccurate replica counts before they impact application stability. By keeping an eye on RCs, you can detect and resolve problems such as pod failures or inaccurate replica counts before they impact application stability.
5. Jobs
By controlling pod lifecycle and container processes, jobs enable automated cleanup, scheduled tasks, and efficient resource management, leading to reliable pod functionality.
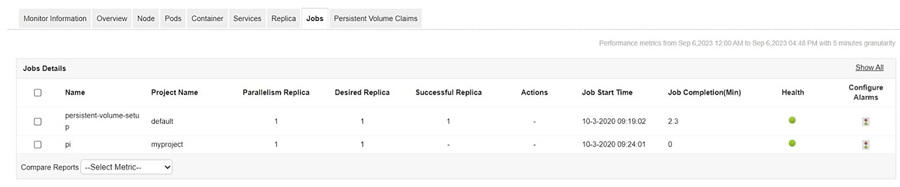
Administrators must track the number of pods created and replicated by each job, as well as the count of successfully completed and auto-terminated pods. Active monitoring of pod health and performance is crucial for ensuring optimal efficiency.
Applications Manager delivers comprehensive monitoring for OpenShift, providing deep infrastructure insights and revealing hidden complexities. Customizable dashboards offer real-time tracking and historical reports of KPIs and container deployments. With our OpenShift cluster monitoring capability, you can monitor the network requests passing through each cluster, the status and performance of deployed pods, and the capacity and resource usage of the clusters. AI-driven alerts reduce manual errors in escalation, and automated responsive actions minimize effort and expenses. Advanced analytics and ML capabilities helps in identifying performance anomalies in the infrastructure beforehand. Functional reports and performance trend forecasts enable proactive planning and future readiness. Discover how Applications Manager can benefit your organization. Try it free for 30 days. To explore its features in detail, request a demo with our technical specialists.