Having more observability data doesn't guarantee better insight. Without a refined alerting strategy, more data means more noise. The teams that sleep well at night aren't the ones with the most dashboards; they're the ones with the clearest alerting logic. Here is exactly how the best ones do it.
1. KPI-driven alerting: what is a business-first APM strategy?
The most common Application Performance Monitoring (APM) alerting mistake is treating every 500-error equally. In 2026, alerting on raw technical metrics such as CPU usage, memory saturation is a secondary health check. The primary alert, the one that pages an engineer at 2am, must be tied to UX and business KPIs.
How to prioritize key user journeys
Configure your APM tool to distinguish between a background image-processing job and a critical checkout transaction. Use application performance index (APDEX) scores as your threshold gate:
- Apdex < 0.7 on login or payment services = high-priority incident, page immediately.
- Non-critical services (e.g., Profile picture upload) degrading = create a ticket for business hours.
- Tag Key Transactions in your APM platform to reserve high-priority alerts for revenue-impacting paths only.
2. Deployment-aware monitoring: Why CI/CD metadata changes everything
In continuous delivery, normal is a moving target. An alert firing during a planned deployment is noise, not signal. Modern APM alerting must be deployment-aware and this is one of the areas where the gap between legacy tools and platforms built for distributed systems is most visible.
How release intelligence works in practice
- Ingest CI/CD metadata from GitHub, GitLab, or Jenkins automatically.
- Annotate performance graphs so engineers see "Version 2.4.1 deployed 3 minutes ago" alongside any error spike.
- Normalize multi-cloud footprints such as AWS Lambda, Kubernetes on Azure, on-premises VMs, under a single reliability standard.
3. Human-centric alert routing: How to build escalation policies that reduce toil
Sending all alerts to a generic #prod-alerts communication channel is one of the most damaging practices in incident management. Effective APM alerting uses persona-based routing with clear escalation tiers. Platforms that support on-call scheduling natively, where escalation policy is configured once and applied automatically, eliminate a huge category of human error during incidents.
A 3-level escalation policy framework
- Level 1 — Warning: Route to your communication channel. Team addresses the issue during business hours.
- Level 2 — Critical: Route to primary on-call engineer via SMS.
- Level 3 — Unacknowledged (10 min): Escalate to secondary lead or SRE manager automatically.
This structure minimizes the repetitive, manual work of dismissing false alarms, and preserves engineering focus for innovation rather than alert fatigue.
4. Error budget burn rates: the SLO-based alerting model explained
Alerting on static thresholds like Latency > 500ms is an outdated approach. In 2026, leading teams alert on Error Budget Burn Rates derived from SLO targets.
Fast-burn vs. slow-burn alerts: Key differences
- Fast-burn alert: Detects catastrophic failures that will consume your entire monthly 99.9% SLO budget within hours. Requires immediate, all-hands response.
- Slow-burn alert: Detects subtle regressions (e.g., a slightly misconfigured database index) that will exhaust the error budget over 20 days. Enables proactive fixes before customers feel pain.
By adopting SLOs-as-code, which involves defining SLO parameters in YAML files stored in your Git repository, monitoring becomes as versioned and peer-reviewed as application code itself. Some teams have gone further, syncing SLO thresholds directly from their infrastructure-as-code pipelines so that monitoring evolves with the product automatically.
5. Agentic AI remediation: How APM auto-remediation works in 2026
An alert without a prescribed action is a complaint, not an insight. In 2026, every critical alert must include a runbook link, with mature teams going further by including automated remediation. The workflow engine in modern APM tools, lets you chain alert triggers to external webhooks, scripts, and third-party APIs without writing custom code.
Three auto-remediation patterns for modern APM
- Automated Scaling: When container saturation is high, trigger a webhook to your orchestrator to add extra nodes before human intervention is needed.
- Safe Rollbacks: When a deployment-aware alert detects a 200%+ error spike immediately following a push, trigger an automated rollback to the last verified Green state.
- Cache Flushes: For known stale-data issues, the APM tool triggers a Redis cache-clear script automatically, often resolving the incident before the engineer logs in.
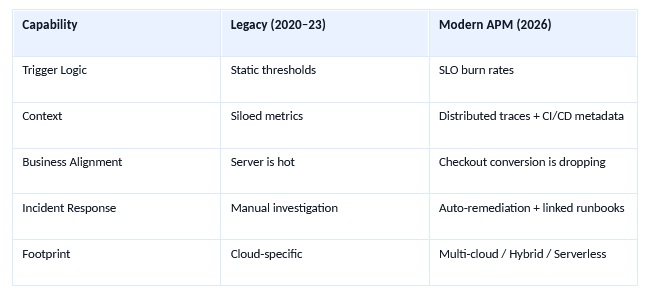
6. APM alerting maturity model: Legacy vs. modern (2026)
The table below summarizes the five core dimensions that separate legacy monitoring from a modern APM alerting strategy:
Turning noise into competitive advantage
The goal of a modern APM lead is not to collect more metrics, it is to generate more clarity. By aligning alerts with business KPIs, automating response via runbooks and agentic remediation, and routing intelligently through tiered escalation policies, monitoring transforms from a cost center into a competitive advantage.
In 2026, reliability is the new product feature. Engineering teams that master APM alerting strategy will outship, outscale, and outrecover their competitors. The frameworks in this guide reflect patterns we've validated across thousands of production environments using ManageEngine Site24x7's APM platform, and the delta between teams that apply them and those that don't is measurable in both MTTR and revenue.