End user experience monitoring goes hand in hand with Application Performance Management (APM). In its Magic Quadrant for Application Performance Management, Gartner considers End User Experience Monitoring to be the first of the five functional dimensions necessary for enterprises to achieve the objectives of APM. After all, analyzing the performance of an application requires data on how application parameters like availability, latency, execution correctness, and quality appear to the end user.
As a result, it seems that every leading APM vendor includes End User Experience Monitoring as part of its solution. Yet, as enterprise IT Ops teams implement these solutions, they can still find themselves blind to what their workforce users are actually experiencing as they use the broad range of business critical applications in the enterprise portfolio. Explaining this conflict requires a deeper look at what other vendors classify as end user experience monitoring. Four different approaches commonly found in the market solve some of the problem some of the time, but each has important limitations to be aware of.
1. Synthetic Monitoring
Synthetic monitoring is an approach in which a script is executed that emulates users interacting with applications. The scripts are run at periodic intervals to proactively identify availability or major execution issues before end user experience is impacted. This approach is useful in determining application availability and establishing general performance baselines, especially for applications that are not accessed by real users 24/7. It is also valuable for applications that rely on APIs to access third party services.
However, this solution knows nothing of an organization’s end users and their actual experience. If you were to call your helpdesk with a problem, this solution would tell them nothing about what you were actually doing or experiencing. In addition, it can be time-consuming to create and maintain the scripts on which this approach relies.
2. Network-Based Packet Capture
These solutions gather network-based response time and error metrics from the network, browser, or application that impact end user experience, such as HTTP/HTTPS or a variety of other network transactions on the wire, such as TCP. This approach requires close coordination with network engineers to identify the optimum points in the network to place the specialized networking equipment required to aggregate and filter traffic for analysis. Although packet aggregation and brokering gear can also be used for security and network management, it becomes more expensive as network speeds increase, driving exponential increases in cost for this approach.
Network-based packet capture solutions do not provide visibility into the actual screen render time within the browser or application, resulting in cases of dubious end user experience reports. Web and network requests/responses can go over the wire sub-second, but if there is heavy client-side processing or a lot of data, the screen within the browser or application can take 10 seconds or more to actually render. Apps delivered via cloud or virtualization also present challenges to this approach.
Furthermore, this approach cannot monitor the wide variety of enterprise applications that are not web-based. In addition, these solutions cannot monitor application activities that don’t generate network traffic, such as opening a cached email in MS Outlook. Finally, these solutions provide no data about what is happening on the user’s device, which often correlates to user experience.
3. JavaScript Injection
This solution injects JavaScript code into a web application in order to get timings of what is occurring within a user’s browser. This approach can include calls to 3rd party apps, so it gets closer to the actual user’s experience, but works only for web applications and hybrid mobile apps.
However, it cannot provide any correlating metrics about what’s happening on the user’s device. Monitoring applications that are hosted outside of the control of the enterprise, such as SaaS based applications, requires JavaScript injection using proxy servers or load balancers, which adds complexity, expense, and implementation challenges for fragmented network topologies.
4. Physical and Virtual Device Monitoring
In today’s converged, next generation end user computing environment, the workforce navigates seamlessly between physical, virtual, and mobile devices as they conduct business using a broad portfolio of apps. Device monitoring solutions monitor operating system metrics like resource utilization (CPU, memory, etc.) and health (application crashes, blue screens, etc.), which are certainly important factors that can impact user experience. Device monitoring has also become popular in the VDI space for physical to virtual assessments and for monitoring the virtual desktop infrastructure.
However, device monitoring does not provide any insight into how end users are actually experiencing the applications they use. When users call to complain that the application in their VDI environment is running slowly, they are not complaining about device metrics like CPU or memory. They are complaining about their ability to execute a business activity, like look up patient, process an insurance claim, or search a customer record.
Closing the APM Visibility Gap
Closing the visibility gap between your workforce’s real user experience and what application-centric APM tools provide requires a different approach. The problem is that you can’t accurately measure end user experience by starting at the data center and looking out. You have to start from the perspective of the end user.
One such approach is to focus from the perspective of the end user across all the applications and devices they use. Monitoring via an agent on the end user’s device, or via an SDK compiled into the code of a native mobile app, enables IT Ops to capture the user experience of the workforce as they use any type of app – mobile, cloud, SaaS – delivered on any type of device. As enterprises adopt the constant stream of new business-critical applications delivered via cloud or on premise, running on physical, virtual, and mobile devices, IT must keep pace, to ensure quality of service and workforce productivity.
Real World Assessment of User Experience Monitoring Approaches
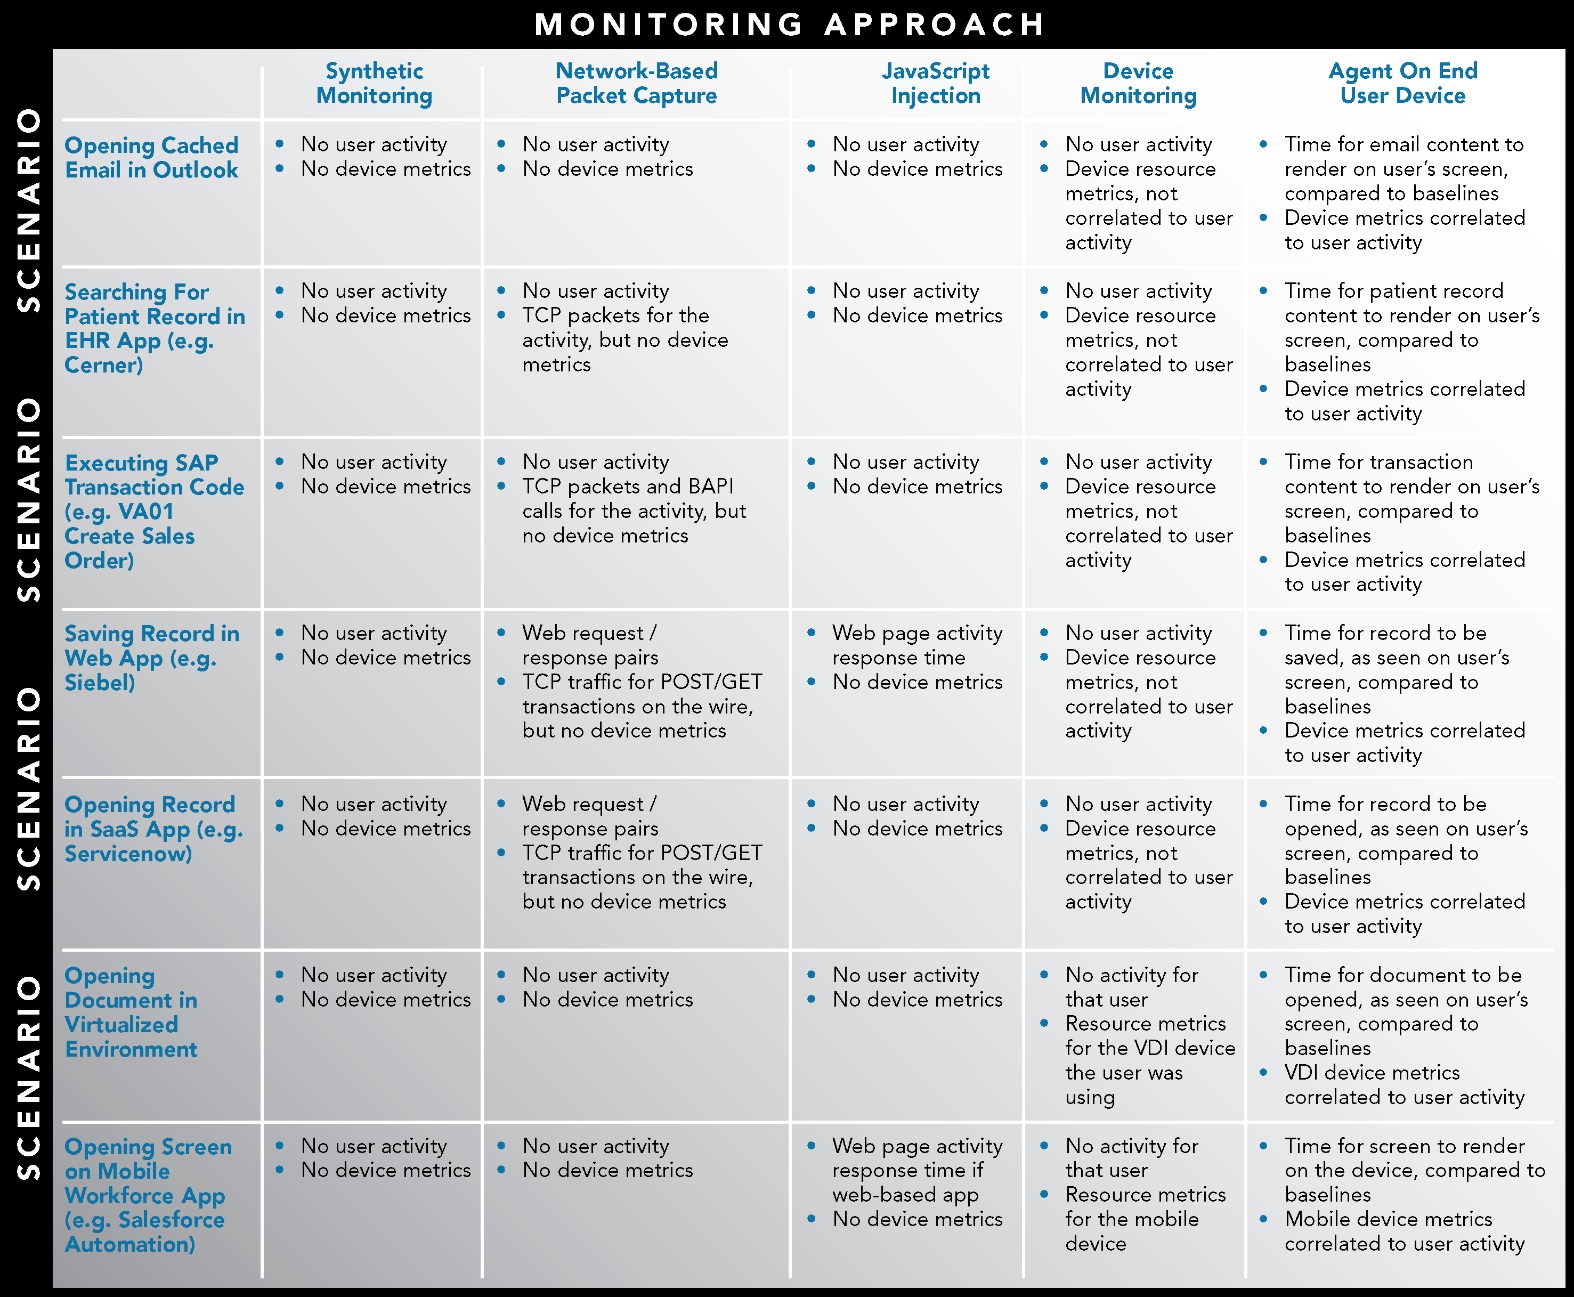
The following table illustrates a side-by-side comparison of the approaches to end user experience monitoring for seven common real world scenarios encountered by the enterprise workforce. The table illustrates the benefits of instrumenting physical or virtual devices with agents, or mobile apps with an SDK. This approach uniquely provides a complete view of end user experience and device metrics correlated to that experience, for the full range of applications and devices that the enterprise workforce relies on in today’s converged cloud, mobile, and virtual environments.
Click on chart for a larger version.
ABOUT Lee Guthrie
Lee Guthrie serves as Director of Worldwide Sales Engineering at Aternity, whose award-winning Workforce Application Performance Management (APM) solution monitors any app on any physical, virtual or mobile device providing a unique, user-centric vantage point that closes the visibility gap existing with network- and server-centric application performance management tools. Guthrie works alongside Fortune 500 prospects and customers, assisting them in architecting and implementing Aternity within their diverse, complex, and rapidly evolving IT environments to deliver optimal end user experience and increased business productivity. Prior to joining Aternity, Guthrie was a Principal Solution Architect with HP (formerly Mercury Interactive). He received a Bachelor of Science in Physics from WPI and his MBA from Clark University.