In a digital world where customer experience defines your business, is your APM solution doing its job?
This may seem like a strange question to open a technical blog on Application Performance Management (APM), but it's not. With customer experience today largely driven by software, we think there's no more important question to ask.
First, let's be clear what "doing its job" actually means: Measuring application performance. Detecting true anomalies. Monitoring in real-time. Helping you build better web services and software.
Now that we have that settled, let's dig into the details.
It's no secret that companies today are using microservices, containers, VMs, and serverless functions in order to build new applications more efficiently. Breaking the monolith into smaller independent services makes it easier for individual dev teams to be more responsive to the needs of the business and release software more frequently. With customer expectations for reliable, accurate experiences at an all-time high, companies need to move faster and faster while always improving quality and security.
What does it mean to build better software — and how do we measure "better" in a world where applications are made up of hundreds of services running in the cloud? What metrics should we be using?
Low-level metrics like CPU or memory utilization are good for tracking the health of individual software components, but on their own, they don't help you understand how well microservices are supporting the business. Custom metrics are needed, metrics that are specific to your business.
Here is a concrete example. A large CPG company runs fire sales of limited product editions through multiple mobile apps and online stores. These campaigns last for three minutes and move extremely large volumes of product. To monitor the effectiveness of the customer experience, the DevOps team tracks standard infrastructure metrics at one-second resolution. This gives them faster alerts while measuring a number of higher-level KPI's, such as products sold per second, number of credit card transactions per second, number of shipping options provided per second, and the number of orders being sent to fulfillment.
The need for real-time problem detection has already pushed many organizations to begin using a metrics platform — instead of traditional APM solutions — for visualization, alerting and analytics of application data. Metrics are great for problem detection, but you also need a troubleshooting tool for problem resolution. The shift to microservices has created critical shortfalls in troubleshooting use cases with traditional APM solutions.
Here are the most frequently cited reasons for why traditional APM is a misfit for monitoring microservices:
1. Traditional APM routinely misses trace data when troubleshooting edge cases and intermittent issues.
2. Traditional APM has a heavy-weight agent approach that doesn't scale in containerized environments and doesn't leverage modern system-wide observability sources such as service mesh.
3. Traditional APM does not account for service dependencies leading to alert storms caused by the cascading nature of failures.
4. Traditional APM lacks prescriptive triage and root-cause analysis. This leads to finding the needle-in-the-haystack scenarios and higher MTTR.
Diving deeper, let's look at how the upfront, data-sampling strategies of traditional APM result in blind spots. Consider this sample scenario:
You get an urgent alert on a priority-one ticket about a group of users who are experiencing unacceptable latency. What do you do?
You have APM! You're confident you'll be able to isolate the root cause within minutes. You type in customer-id to see the trace and find out which service is causing the latency but … you get a blank screen! No trace found. You end up in war room with a bunch of your colleagues trying to figure out what happened to cause a ton of productivity loss.
It happens all the time, especially with intermittent issues. There is something different about these user transactions — maybe the payment type, maybe these users are buying a certain item, or maybe they're hitting canary release. While the vast majority of transactions are processing as usual with average latency, p99 transactions are failing the SLOs. Since APM solution takes a probabilistic and random approach, it is not able to tell you why. You're flying blind.
To limit production overhead and reduce cost, traditional APM vendors sample the number of transactions they capture for further analysis. Sampling refers to the decision about which trace to capture and retain.
Sampling approach, referred to as head-based sampling, makes random decisions at the start of the very first transaction and propagates this decision across service boundaries. Head-based sampling is:
A probabilistic approach, where a given trace is sampled randomly with a certain fixed percentage limit; or
A rate-limiting approach, where a given number of traces are sampled per unit time
These approaches worked well in homogeneous, monolithic environments where a given trace would indicate the health status of the unitary system. But they are a misfit for microservices architectures entailing multiple runtimes across different hosts. Since sampling decision is made at the initiation of the transaction, it cannot be changed, even if a performance impact is observed on a downstream host.
Performance Variance and Outliers Tell the Most Interesting Stories
If you are only capturing service performance on average, you may be missing events that indicate systematic performance anomalies. Consider the following figure showing the average latency of one of the microservices.
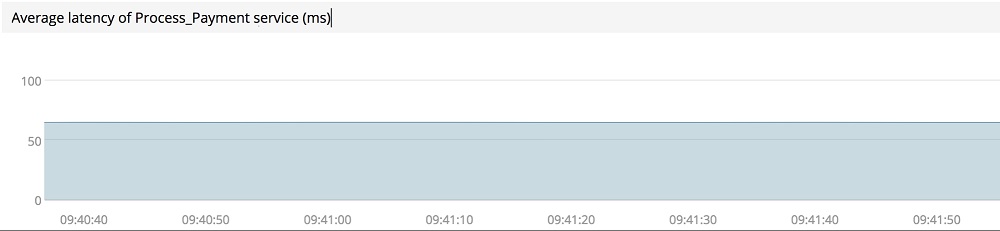
On the surface, everything looks good. But since you're not capturing all outlier transactions, you may be missing the indicators pointing to anomalous behavior.
In the microservices world where a user request is processed by multiple services, it's important to observe the variability in high-percentile latency, end-to-end along the service chain. Consider the following scenario showing p(99.9) transactions at a very high resolution.
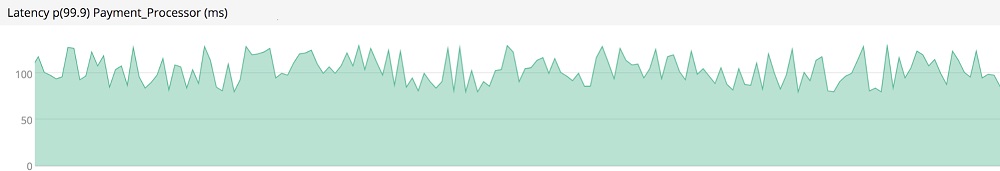
Even if traditional APM tools can point to outliers (by capturing RED metrics), they would lack the context and additional details to isolate and troubleshoot the root cause. Additionally, higher latency in a backend service doesn't necessarily mean systematic performance issue. We need to determine whether high latency represents a true anomaly by comparing to historical levels against multiple dimensions across service boundaries.
Another use case where traditional APM fails is sampling at the service level when the service exposes multiple procedure calls. APM will capture only the high-frequency procedure calls and may miss the low-frequency procedure calls. You'll be blindsided when triaging and debugging.
The chief architect at a major consumer technology firm put it this way: "In the age of social media, companies have to deliver flawless end-user experiences consistently. They also have to understand variability and resolve performance issues in near real-time."
For monitoring microservices, it's critical to analyze every single transaction that is flowing through all the microservices.
A Better Strategy for the Microservices World: Tail-based Sampling
In tail-based sampling, the decision to retain a trace is made at the completion of all transactions instead at the beginning of the first span. It's really an intelligent selection strategy that can capture interesting anomalous transactions. As Sambasivan et al. explain , using tail-based sampling, anomalies can be explicitly preserved whereas most of them would be lost due to the randomness of head-based sampling.
None of the traditional APM vendors support tail-based sampling.
The figure below shows the trace data collected over the same period of time from a distributed application using head-based and tail-based sampling strategies. The first histogram is missing errors and the trace data while tail-based sampling approach, as shown in the second histogram, captures those anomalies.
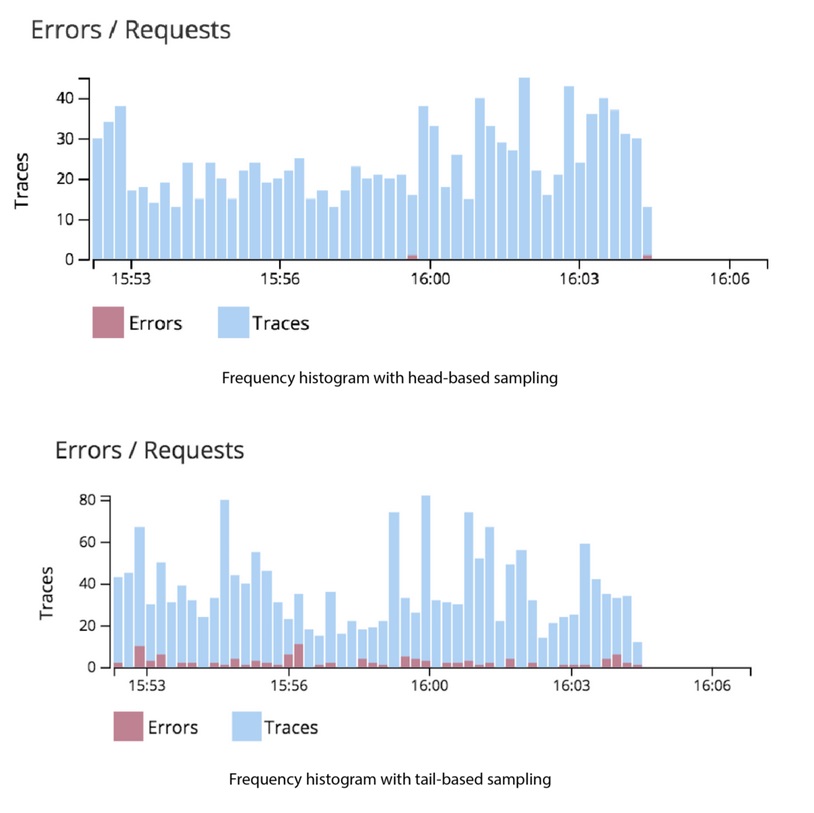
As a result of the naive, head-based sampling strategy, you would miss important anomalous transaction data when you need it the most – while troubleshooting end-user issues and optimizing your applications for better performance and user experience. In effect, you are flying blind with traditional APM.