Most websites that rank in Google's top 20 search results do not currently pass the minimum requirements for a good page experience set out in the search engine's new Core Web Vitals update which officially rolls out from mid-June, according to new research from Searchmetrics.
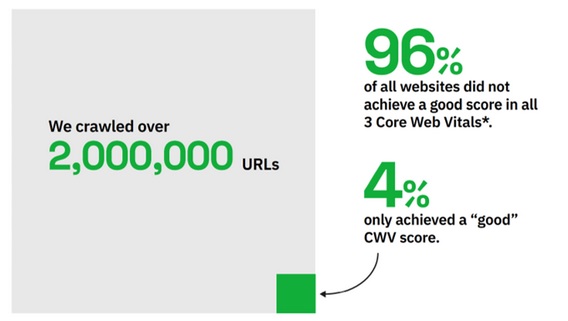
96% of sites tested in US desktop searches and more than 90% of those in mobile searches fail to meet Google's three Core Web Vitals thresholds for good website performance and usability and risk their rankings being negatively impacted from June.
Currently only the top 2 or 3 ranking websites in search results achieve the required "good" score in most of the Core Web Vitals metrics according to the analysis by Searchmetrics.
The study which analyzed over 2 million web pages appearing in the top 20 Google results in the US, UK and Germany, reveals that there is already a positive relationship between pages that rank higher and those that perform well on Core Web Vitals metrics (suggesting Google already rewards sites that offer better usability). Once the update officially rolls out, the Core Web Vitals are likely to have even more influence on page rankings, according to Searchmetrics.
One notable exception to the general trend of the early findings was Google-owned YouTube, which was currently found to rank high in searches despite performing poorly for the Core Web Vitals related to speed of loading and responsiveness. This may change when the update officially rolls out in June, but YouTube might possibly be gaining an advantage from its strong brand recognition which is helping it overcome individual negative usability issues.
On the other hand, online encyclopaedia, Wikipedia, currently performs well for all the Core Web Vitals metrics — it might be a good example of the type of user experience others should be aiming for. Its good scores are related to its lightweight approach to web design, using mainly text and optimized images and the fact that it avoids using too much dynamic content such as ads which can jump around on the page and create a negative experience.
Google is introducing Core Web Vitals to assess real-world web user experience in three areas:
■ How quickly the content on a page loads
■ Responsiveness: the time taken to respond to a visitor's first interaction, such as clicking on a button or a link
■ Visual stability: does the layout or content jump around?
These signals will be included in Google's search algorithm with the search engine aiming to deliver a ranking boost to web pages that are delivering a good experience.
"The Google Core Web Vitals update is in many ways a response to websites not really living up to user expectations. It's a clear message to website owners that not putting users first may have a negative effect on rankings," said Marcus Tober, Founder and Chief Evangelist at Searchmetrics. "Our initial findings suggest that there's a lot of work to do for most websites to get their usability up to par. And, of course, ecommerce and other enterprises need to be aware that a good user experience will not just influence their Google rankings but have a positive business impact, it can help to drive conversions and encourage visitors to stay onsite longer, engage and keep returning."
According to Searchmetrics among the reasons behind the poor user experience highlighted by the study is the rise of "Code Bloat" or unnecessary code on webpages built using templates included within website builders such as WordPress and Wix, as well additional code in web plugins, all of which slows pages down and creates optimization challenges.
Another issue is dynamic content such as ads and newsletter opt-in boxes which can cause the layout of pages to shift if they are not implemented properly.
Five key findings based on the US findings of the research include:
Only sites ranked 1-3 deliver a good user experience for loading important page content quickly
Largest Contentful Paint measures the time it takes for the largest image or block of text to become visible when a user clicks onto a page. For a good user experience, Google suggests this should happen within the first 2.5 seconds. But of the top 20 ranking websites in search results, only the first 3 positions are below this threshold. The average time for pages listed in the top 20 positions is 3 seconds (21.3% slower than Google's benchmark).
Most sites can't pass the test for controlling shifting elements on their pages
Cumulative Layout Shift tracks how much the elements on a page jump about or shift creating a negative user experience. And the analysis indicates most sites perform poorly on this. Google specifies a score below 0.1 as "good", while below 0.25 "needs improvement" — everything else is "poor". The main causes of layout shifts include dynamic content and media pop-outs such as "subscribe now" boxes or ads. According to the data, only the position zero results (featured snippets) which Google places above the traditional organic results to provide quick answers to factual queries, achieves a "good" score. Position one is close, but all other search results fall into the "poor" bracket (below 0.25). The average score or the top 20 results is 0.38 (275.6% worse than Google's required "good" rating).
Majority of sites fall short of Google's benchmark for good responsiveness
First Input Delay measures the time it takes for a page to respond to a visitor interaction such as someone clicking on a button or a link. Because this can only be measured if a user actually interacts with a page, Google suggests using the Total Blocking Time (TBT) as a good proxy measurement. TBT assesses the total time taken by tasks that stop the user interacting with a page (such as retrieving images, videos, scripts etc).
And the research suggests that the top 5 ranking results have an average total blocking time of 554 milliseconds — 84.6% slower than Google's "good" benchmark of 300 milliseconds (the average for top 20 search results is 136.7% slower that the benchmark). Only sites that appear in the top 2 rankings are consistently below Google's "good" performance threshold, implying that there are a lot of asset-heavy websites with long loading tasks that delay user responsiveness.
YouTube ranks high despite currently showing poor Core Web Vitals
YouTube was found to currently have poor Core Web Vitals scores around speed of loading (LCP) and responsiveness (FID). If other websites performed as badly, they would be judged to be offering a low-quality user experience. But YouTube is ranking high despite this, most likely because of the platform's overwhelming popularity, which helps it deliver positive user signals. Most other sites could not afford to score so low on individual user experience metrics because they do not have the luxury of YouTube's extreme brand recognition according to Searchmetrics.
Wikipedia could be the "Poster Boy" of the new Core Web Vitals update
Wikipedia currently meets or surpasses Google's Core Web Vitals performance thresholds across almost all metrics, meaning it could serve as a good example to the web community. The encyclopaedia site's lightweight approach to web design, using mainly text and optimized images means it tends to have a low score for Largest Contentful Paint on many web pages. It also has good responsiveness with a Total Blocking Time of 0 on a lot of pages which it achieves by avoiding long loading tasks created by plugins, excessive JavaScript or large video files. And because it uses a relatively fixed layout for the vast majority of its pages and limits dynamic content with no ads, it does not suffer from content or layouts jumping around.
Methodology: Searchmetrics crawled over 2 million URLs, crunched the numbers, and performed correlation analysis across the top 20 organic Google search positions. in three countries: the USA, UK and Germany. The keywords were filtered based on relevance and the regional keyword sets were kept as distinct as possible. Core Web Vitals and other performance metrics for the search results were measured by accessing the PageSpeed and Lighthouse APIs. Once the data had been gathered, Searchmetrics performed a correlation analysis to calculate a correlation coefficient for each performance metric - this value gives an impression of whether a good score in the selected metric is associated with good page rankings. Simple averages for the top 20 and top 5 positions were calculated per metric, as well as how close these values are to Google’s benchmarks.