Recently as part of an engagement reviewing a customer’s performance engineering maturity level and looking at what Application Performance Management (APM) tools best fit their needs I was asked, “Why not do it ourselves?”
By that they meant a combination of log scraping, host metrics gathering etc. to trace critical business transactions end to end through their infrastructure. It is possible to do this, if you change your code, log a consistent transaction tracing call into every log, pull that back to some central location and do the required data analysis. You then, of course, need to build a whole set of data analysis tools, management tools (This isn’t going to be a small amount of data for a large system) and graphing/ visualization.
A large chunk of this can be achieved by using open source tools but in a complex IT system that spans multiple systems, teams, third parties etc. It is unlikely to be feasible without a lot of work. We are talking yearlong project here with significant ongoing maintenance costs. Every time someone changes their code, bang goes your custom APM solution. We didn’t have to go far in the analysis to demonstrate it was a non-starter for this customer, particularly as they rely on third parties and don’t have a large in-house development team who would have enough control to even start building this.
But if you were going to create an OpenAPM yourself, would it even be feasible?
Gartner has some criteria for commercial APM tools to be considered “true” APM -
■ End-User Experience Monitoring (EUM) — The capture of data about how end-to-end latency, execution correctness and quality appear to the real user of the application. Secondary focus on application availability may be accomplished by synthetic transactions simulating the end user.
■ Application Topology Discovery and Visualization — The discovery of the software and hardware infrastructure components involved in application execution, and the array of possible paths across which these components communicate to deliver the application.
■ User-Defined Transaction Profiling — The tracing of user-grouped events, which comprise a transaction as they occur within the application as they interact with components discovered in the second dimension; this is generated in response to a user’s request to the application.
■ Application Component Deep Dive — The fine-grained monitoring of resources consumed and events occurring within the components discovered in application topology discovery and visualization dimension. This includes server-side components of software being executed.
■ IT Operations Analytics (ITOA) — The combination or usage of techniques, including complex operations event processing, statistical pattern discovery and recognition, unstructured text indexing, search and inference, topological analysis, and multidimensional database search and analysis to discover meaningful and actionable patterns in the typically large datasets generated by the first four dimensions of APM. Additionally these data sets are increasingly being analyzed for not only operational information, but business and software analytics.
Let’s take some of these in no particular order …
End-User Experience Monitoring (EUM)
Straight away there is a tool I have previously selected for a customer as the best option for open source EUM: Yahoo’s Boomerang. This uses some javascript in your pages to time the end user response times, load time, render time etc., even tell you what their bandwidth is, and send those metrics back to your servers (or a dedicated one) for analysis. This can either capture all requests, or use sampling so only a subset are measured. So on the face of it, EUM metric collection on its own is not an issue.
Application Topology Discovery and Visualization
Here they mean instrumentation. Typically, Gartner expects an APM tool to be able to instrument the latest Java and .Net versions at a minimum. This is not necessarily an issue at face value, there are a plethora of Java BCI (Byte Code Instrumentation) tools out there. But then you start to think about the logistics, you need an agent to gather those metrics and pass them back to a central server. What does this agent look like? What does the server at the other end look like?
Suddenly it is a lot more complex, not to mention the overhead with most of the profiling tools. They are not designed to be “always on”, they are deep dive problem determination tools you use in test or development. Maybe production if you are really desperate, but only off peak. They produce mountains of data from the JVM, heap dumps, thread dumps, traces that produce megabyte upon megabyte of data.
So far I’ve only seen one open source APM agent based tool that gets close, and it is only for Java, nothing for .Net yet. Zorka.io is an open source agent based Java monitoring tool, it supports the majority of J2EE application servers, claims to be low overhead and will integrate into multiple back end server monitoring tools such as Nagios and Zabbix. So that covers part of the requirement for application deep dive, for Java anyway. .Net is still a TODO and I will be interested to hear of any projects that are trying to cover that base.
Here it gets a bit harder, these are more subjective, also harder for OpenAPM to currently fulfil.
User-Defined Transaction Profiling
A key benefit of APM. You can pick out an individual user journey and look at what EUM metrics they have, HTTP server metrics, how long they spent in your J2EE server(s) and how that transaction fanned out to other third party systems or your own back end systems, all with timing. Most of the open source tools are focused on time-based metrics, averaged even. I’ve not seen one that allows you to see the end to flow of a transaction across multiple systems for example. Which leads on nicely to the next criteria.
Application Component Deep Dive
This is usually a fancy chart that might look a bit like this:
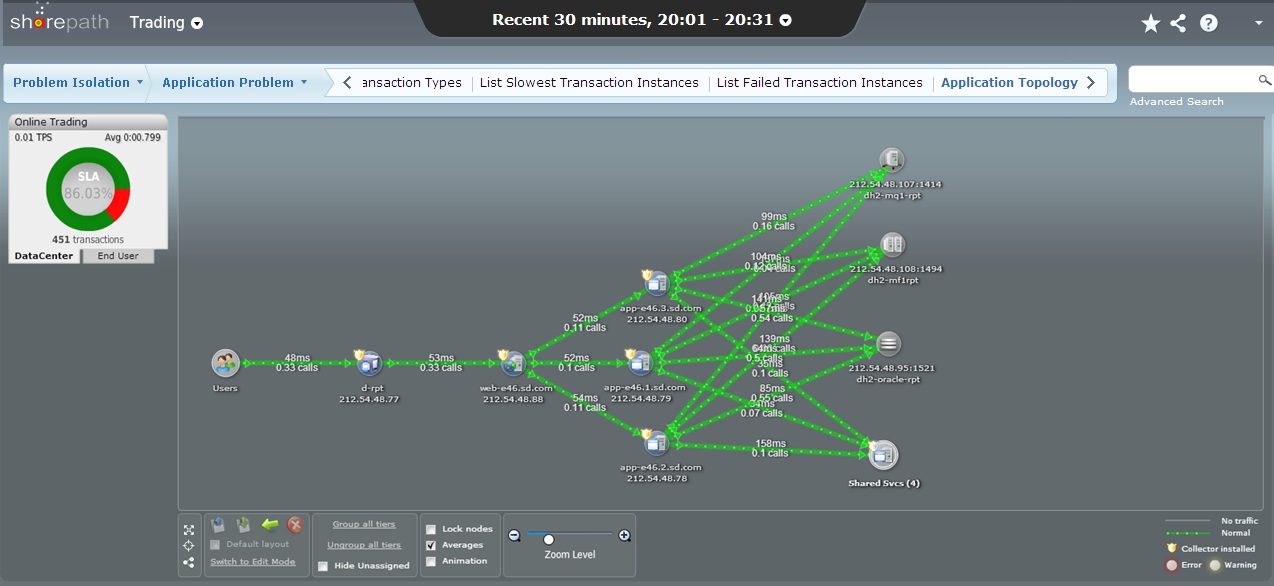
But it is more than just getting a nice chart that you can show off in IT Operations meetings. This is a great tool for root cause analysis, rather than having to trawl though reams of logs from multiple systems you can see immediately where a particular transaction was held up. Most will show you why it was held up as well, down to the code level. This is a big problem for our OpenAPM and something that would have to be custom created, as far as I can see. We can certainly tie transactions together to a degree with something like jsessionid. Although when you go past one particular application server into another layer, off into JMS to back end systems … You have a requirement to start instrumenting your code to pass a token, jsessionid, or other back into downstream systems to track your transactions.
IT Operations Analytics (ITOA)
This is where it gets a bit vague. You suck all your transactions data back into something … This something does lots of statistical magic to solve all your IT operations issues. To be honest I don’t think any commercial APM solutions have a complete vision here. Some try and graph, dashboard and even statistically analyze the data they collect. Others just focus on capturing and correlating all the events that make up an end to end transaction and provide APIs so you can import in that data into other systems like Elasticsearch, Nagios, Splunk so you can do more in depth analytics on them.
So for our OpenAPM we have a few choices here, ELK (Elasticsearch, Logstash and Kibana) comes pretty close to being an ideal solution, without the topology visualization anyway. It is extremely extensible and the topology function could be added to it, if there isn’t a plugin already.
This has been a quick overview of the bare idea of OpenAPM and some thoughts on open source tools that might fit in some of the gaps. While there are components that perform some of the functions typically associated with APM, tying that all together into a whole that could be called APM by Gartner’s standards would be far from easy. Intechnica runs an APM lab, testing and trying out commercial APM products to demonstrate the overhead, ease of installation and metrics views that are available by APM vendor. It would be interesting to perform this for a Zorka / ELK / ??? stack … But therein lies the problem with OpenAPM at the moment — how to implement it, what packages to choose, how to plumb them together. It all takes a lot of work compared to the commercial vendors. With no guarantee of success at the end.
James Billingham is a Performance Architect at Intechnica.