The global shift to working from home (WFH) enforced by COVID-19 stay-at-home orders has had a massive impact on everyone's working lives, not just in the way they remotely interact with their teams and IT systems, but also in how they spend their working days. With both governments and businesses committed to slowly opening up offices, it's increasingly clear that a high prevalence of remote work will continue throughout 2020 and beyond.
This situation begets important questions:
To what extent is remote employee productivity affected by application performance?
Are remote employees working more?
If so, is it because applications aren't performing as well as employees expect?
How do companies need to invest in IT to ensure the same digital experience whether employees work in the office or at home?
These questions form the premise of the Aternity Global Work Productivity Tracker.
Previously, we looked at how the working day has changed for WFH employees and now have data that shows how business applications' digital experience changed in the move to WFH, specifically with different industries and countries.
Application Performance Around the World
Numerous factors influence the responsiveness of applications, including the specifications of devices, the speed of the network, the distance from employees to datacenters or SaaS instances, the type of applications used, and the complexity of the work performed. These various influences mean that the average responsiveness of applications differs by country.
Figure 1 looks at the number of seconds employees spend waiting for an application per minute of usage by country. Employees in South America, Africa and India experience the worst application performance, taking, on average, twice as long as Europe.
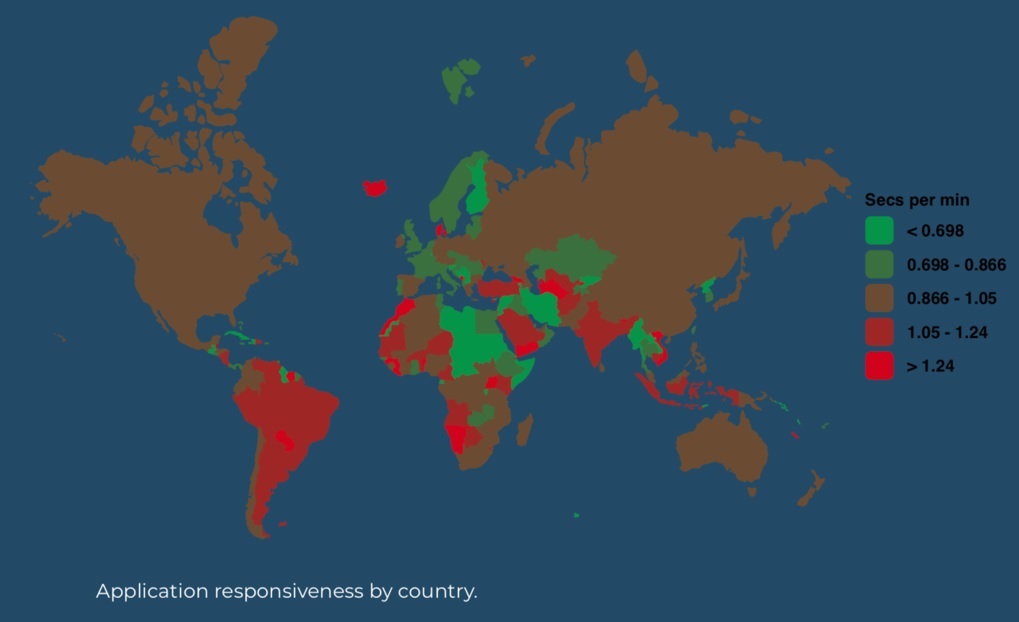
Figure 1
Education Ranks Last in Application Performance
Figures 2 and 3 compare the average application responsiveness seen by employees across different industries. Productivity applications in use in education and retail organizations have the worst performance, possibly due to a lower level of investment in new technologies for employees, whereas healthcare and legal lead the pack.
For collaboration applications, education also has the worst performance, with retail, healthcare and legal topping the group for best performance.
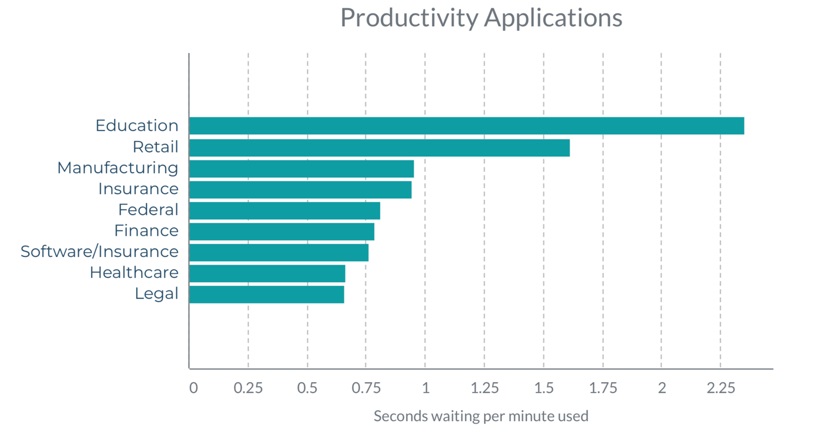
Figure 2
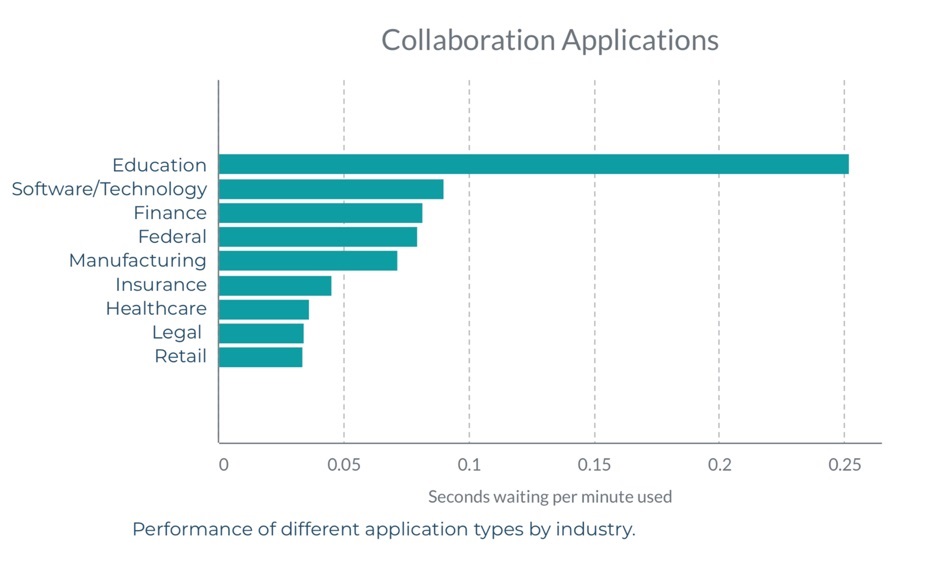
Figure 3
Niche Business Apps Experience WFH Lag
Figure 4 shows how the scale and timeframe of the move to WFH differs by application type. Workers who only use standard productivity applications such as Outlook, Word and Excel were able to make the transition earlier and more effectively than workers who rely on more heavy-duty applications such as CAD systems. Large-scale home use of some applications specific to certain job functions, such as call center agents, lagged others by an average of two weeks as working practices had to be changed for a WFH setting.
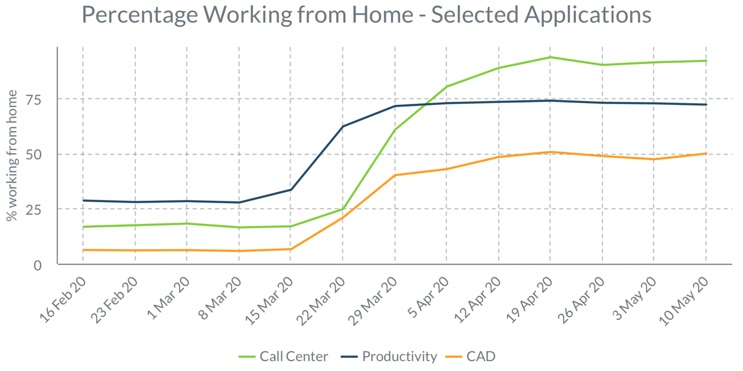
Figure 4
Employee Hours Goes Up, Productivity Goes Down
There was an early increase in the amount of time spent in front of the computer when employees initially transitioned to remote work; however, productivity has dropped. Our researchers took a look at the number of business transactions – such as creating an Excel spreadsheet or sending an email – that were recorded in these common applications, and found only very slight increases, except for a 5x increase in Zoom web conferences (Figure 5). A near constant volume of these business activities since the start of lockdown demonstrates that the extra hours workers are spending in front of their computers is not directly translating into increased productivity.
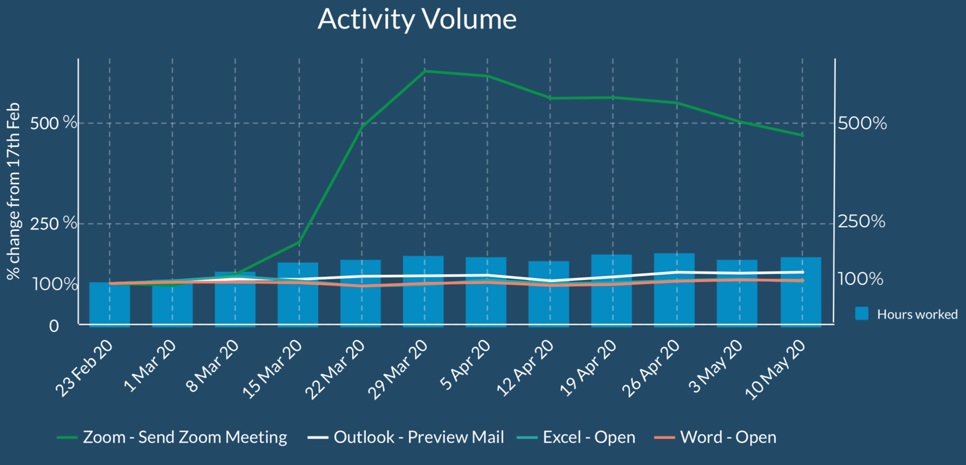
Figure 5
The other reason that the extra working hours did not produce extra productivity is that some applications perform differently in WFH environments.
Figure 6 is a sample of the time taken to perform tasks within applications, from when the user presses the key to when they get the results on their screen. A few highlights from this chart include:
■ SaaS and cloud-native applications have similar or sometimes better performance in remote environments. Client-server applications designed for use on-premises, however, have degraded in performance during the quarantine.
■ Activities that are opening or saving remote content (e.g. saving a large spreadsheet to a shared drive) are slower when working from home.
■ Slower application performance negates the increase in working hours spent in front of the computer.
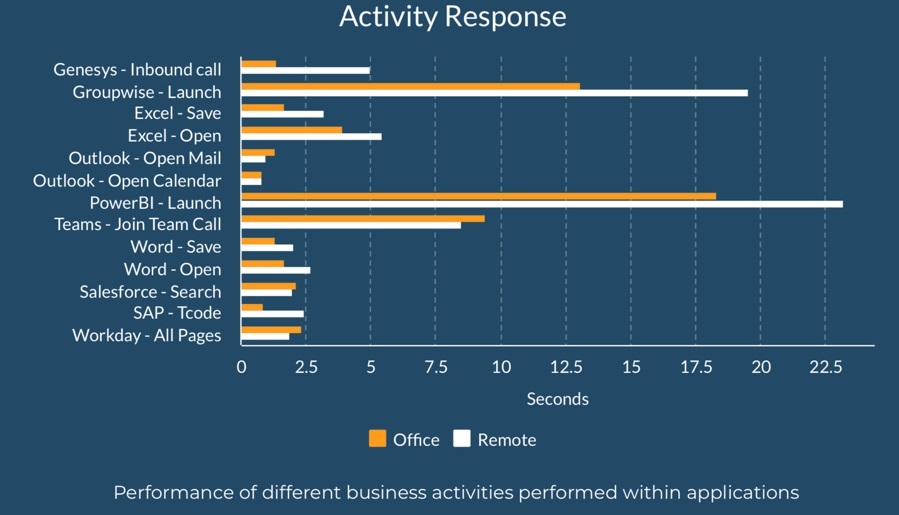
Figure 6
Employee Experience Varies on a Case-by-Case Basis
In additional to broad global trends, we're finding that it is difficult to deliver a consistent experience in a remote environment due to individuals' set of circumstances and available technology. Looking only at averages will cause organizations to miss the nuances of every employee's unique experience.
As an example, Figure 7 shows the distribution of response times for 48,294 instances of opening an Excel spreadsheet during a one-hour period from 10:00-11:00am EDT on May 11. This shows a very high standard deviation as it took less than 1 second for the vast majority of users, but the average was 5.55 seconds, reflecting the fact that a significant number of instances took considerably longer (up to 3 minutes in some cases).
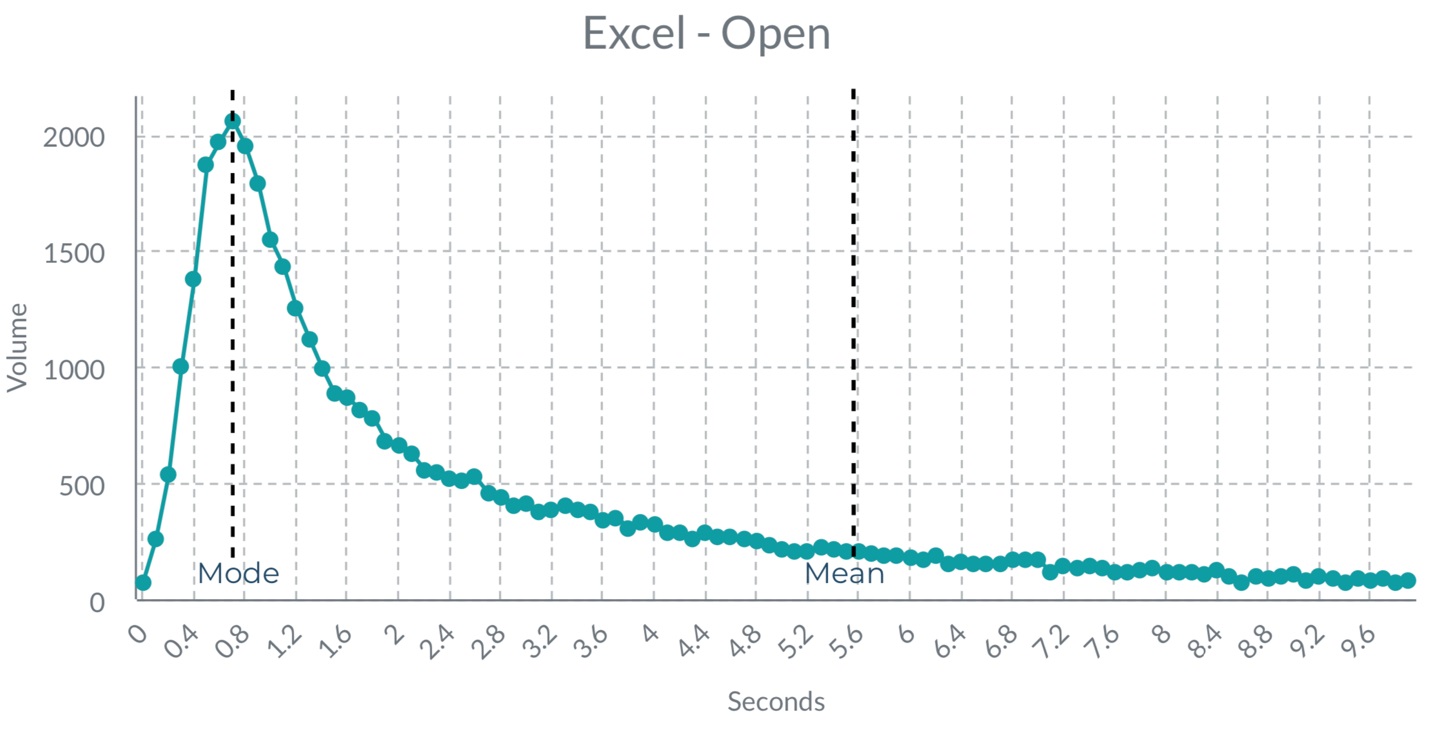
Figure 7 - Click on image above for larger version
As businesses shift their WFH strategies from short-term fixes to long-term strategies, it's important to monitor the unique digital experience of every employee. There aren't any major red flags right now but, as employees increasingly put wear and tear on their laptops and operate without much managerial supervision, IT issues could quickly eat into productivity. Smart businesses have a clear understanding of how apps are performing on their all of their employees' endpoints to ensure people are able to work optimally at all times.