IT engineers and executives are responsible for system reliability and availability. The volume of data can make it hard to be proactive and fix issues quickly. With over a decade of experience in the field, I know the importance of IT operations analytics and how it can help identify incidents and enable agile responses.
Start with: Everything You Need to Know About IT Operations Analytics - Part 1
Start with: Everything You Need to Know About IT Operations Analytics - Part 2
How Analytics Can Improve IT Operations and Services
IT operations is a metrics-driven function and teams should keep score as a core practice. Services and sub-services break, alerts of varying quality come in, incidents are created, and services get fixed. Analytics can help IT teams improve these operations.
Through the entire incident management pipeline, key performance indicators (KPIs) can help organizations find gaps in their process, increase efficiency, and measure the performance of their people, systems, and tools.
Service downtime or its opposite — service availability and reliability — are the most critical measures that require constant monitoring and improvement.
Bear in mind these pointers:
■ The quantity and quality of event and alert streams vary.
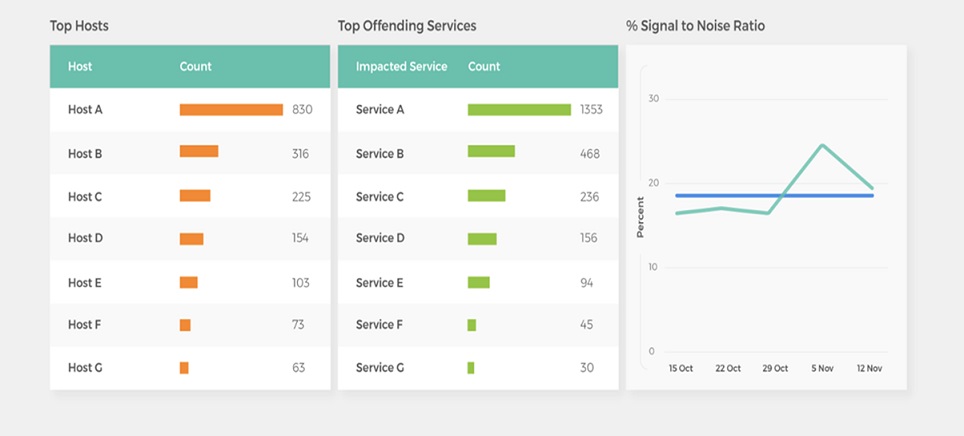
■ The signal-to-noise ratio helps define how good your primary process input is. As you implement improvements, measure the changes.
■ MTTx metrics are useful. Pivot them by team, service, source, or other attribute to rapidly identify gaps.
Examples of IT Operations Analytics Reports and When to Use Them
Operational analytics reports and dashboards give insights into key trends about IT operations management. Some of the most-watched items are how engineering teams and IT systems are performing. Here are a few examples of typical IT Ops reports used by IT Ops managers and executives:
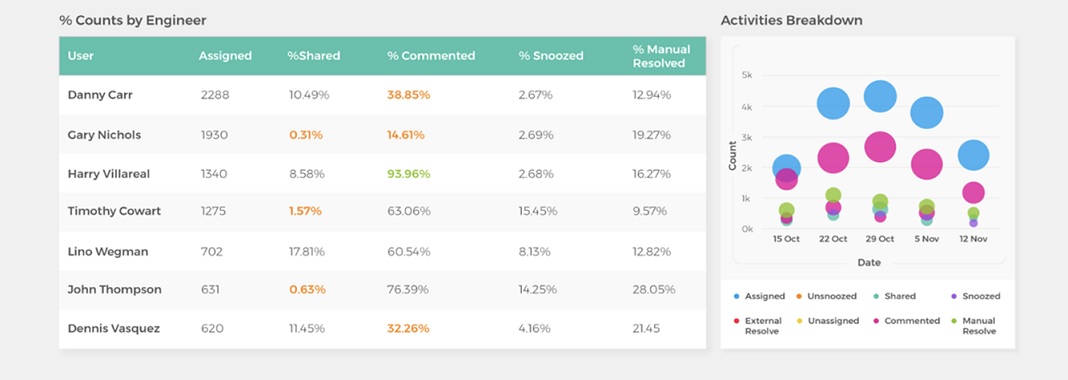
Team Performance: This report shows incidents assigned to each engineer, the percentage resolved, whether the engineer resolved or escalated the issue, and more. This helps track workload balancing and team efficiency, as well as drive accountability.
Hotspots: The report helps identify services that are creating the most noise. You can use this report in combination with other data to determine if certain systems are providing useful event data or simply creating alert fatigue.
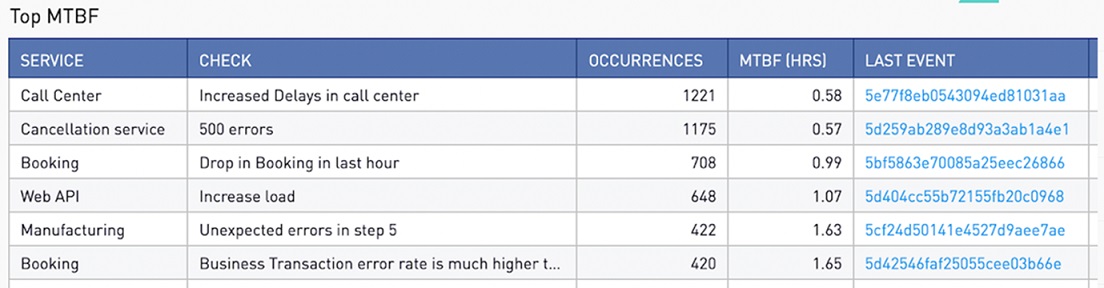
Mean Time Between Failures: This shows the average time between failures. For example, this can track which systems or applications take the longest to bring back online. This lets you know where to focus improvement efforts.
IT Operations Analytics Use Cases
ITOA's most important role is to drive better business performance. This results from IT systems that are more reliable and efficient. Use cases demonstrate how IT analytics can impact customers and the business.
With the right solution, IT operations managers can view the status of all monitoring and surveillance systems from one screen. This adds clarity and efficiency.
For example, a video gaming studio has many players online around the world simultaneously. The volume of alerts can easily be overwhelming. But ITOA can consolidate repeat instances of the same problem into one issue, a process known as compression. Then analytics correlates these issues with system changes and health conditions to pinpoint causes.
When the studio introduced a new online multiplayer game, the launch triggered 3,000 alerts. But analytics compressed those by 99 percent, resulting in only 35 tickets. That made the IT Ops team's job manageable, and it improved the experience for customers, resulting in a win for the business.
Predictive Analytics in IT Operations
Predictive analytics has various uses in IT operations. These findings anticipate what will happen in your IT environment so you can take action. For example, predictive analytics can identify the best corrective steps to solve recurring issues.
If analytics forecasts outages, the IT team can act proactively. They can perform maintenance or bring backup systems online to prevent a disruption. Predictive analytics can enable teams to automate responses to common incidents.
Machine Learning for IT Operations Analytics
Machine learning powers predictive analytics. These ITOA algorithms are trained to learn normal and abnormal conditions. They include context such as time of day, season, business conditions, and other variables. Machine learning's strengths include the ability to work with all kinds of data.
This allows AIOps to work with structured and unstructured information, such as the output of various monitoring, topology, logging, and other tools. Despite the plethora of data, analytics can filter out irrelevant alerts and noise. Then ITOA flags meaningful anomalies. This enables teams to catch issues before users are affected.
But machine learning is not without challenges. Depending on whether the machine learning is a version of explainable AI or "black box AI," IT teams can still encounter false positives and notification fatigue.
Also, refining and advancing ML-driven analytics require data science expertise. The primacy of data scientists in building many systems makes the analytics process very opaque. This "black box" quality causes distrust and skepticism among some user groups. IT engineers want more transparency and control.
Leverage ITOA for Business Benefits with Unified, Purpose-Built Analytics
ITOA leaders can achieve faster incident resolution and prevent outages by leveraging unified analytics that is purpose-built for IT operations. Purpose-built IT Operations Analytics are not general-purpose reporting or BI tools that have been adapted for IT operations. Instead, purpose-built IT operations analytics offer out-of-the-box IT ops KPIs, widgets and dashboards, and are designed for different IT operations personas such as NOC managers and directors, VPs of IT operations, and application and service owners.