Underneath the umbrella of partnering with the business, automating the alerts, and trending on performance comes Application Performance Management. APM has many benefits when implemented with the right support structure and sponsorship. It is the key for managing action, going red to green, and trending on performance.
Gartner has defined five dimensions for managing application performance, and this article outlines how the Auto Club Group prioritizes each of these dimensions -- based on our experience over the last six years spent fine tuning different facets of the model to better support the business.
It is important to understand that the technologies within each dimension are typically deployed by different owners, and thus the priorities may be different with each stakeholder. I am suggesting from an overall APM perspective that there are certain areas of focus that will bear more fruit earlier on than others, as you work to cultivate the solution. These areas are referenced as "Primary" below, with the lower priority dimensions referenced as "Secondary".
So where do you start with APM? Consider the APM Conceptual Framework to help prioritize your next actions:
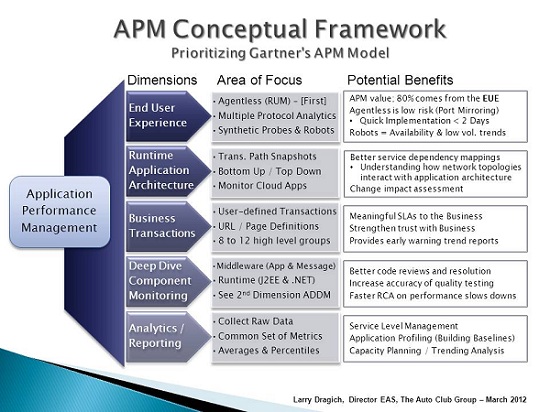
End User Experience – (Primary)
Real-time Application Monitoring, also referred to as Top Down monitoring, is the cornerstone that gives the EUE its tangible value. It has been our experience that Real User Monitoring (RUM) technology provides at least 80% of the APM value in terms of application visibility for the business, and helps lay the foundation for performance trending and predictive analysis.
This approach of Top Down monitoring has two components, Passive and Active. Passive monitoring is usually an agentless appliance and low risk to implement using network port mirroring. In general, this can be up and running providing details of the application performance in less than two days. When considering an agentless solution, a key feature to look for is the ability to support multiple protocol analytics (e.g. XML, SAP ABAP, SQL) since most companies have more than just web-based applications to support.
Active monitoring, on the other hand, consists of synthetic probes and web robots which help report on system availability and predefined business transactions. This is a good complement when used with passive monitoring that together will help provide visibility on application health during off peak hours when transaction volume is low.
Runtime Application Architecture (Secondary)
A minimal take away here would be to ensure that you have up/down monitoring in place for all nodes/servers within the environment. Also referred to as Bottom Up monitoring, this will become a critical component to build on when working on event correlation to help implement an overall runtime architecture solution.
Providing the transaction path snapshots will also help bring together the Top Down and Bottom Up monitoring. This will give you better service dependency mappings and an understanding on how the network topologies interact with the application architecture. Keep in mind though the runtime views are something you can focus on after you have built a solid application profile with the EUE, Business Transactions and Reporting/Analytics dimensions.
Business Transaction (Primary)
Using a subset of this dimension, we focus on the user defined transaction or the URL page definition that has some meaning to the Business community. There may be 200 to 300 unique pages definitions for any given application however; we will group them together into 8-12 high level business transaction categories. This helps begin the process of articulating meaningful SLAs to the business, and provides early warning trend reports on performance degradation before it becomes apparent to the majority of the user population.
Once your APM solution matures, you can then fine tune what each business transaction means as you implement other facets of the APM model. Keep it simple, start with broad categories and then refine them over time.
Deep Dive Component Monitoring (Secondary)
This will require an agent install and is generally targeted in the middleware space focusing on the Web, application, and messaging Servers. It should be able to give you the runtime view of the J2EE and .NET stacks, tying them back to the user defined business transactions. A robust solution will give you a clear path from the code execution standpoint (e.g. springs, struts, etc.), to the URL rendered, to the user request and where it came from.
Since this is closely related to the second dimension in the APM model, you will find that most products in this space will also provide application discovery dependency mapping (ADDM) as part of their broader solution.
Analytics/Reporting (Primary)
A good practice is to collect the raw data from the other tool sets that will allow you to answer a wide variety of performance questions as they arise. Most products will summarize or roll-up the detail data for reporting and archiving purposes and may fall short in answering long term trending questions. It is also beneficial to find a product that has an open data mining interface within the context of their own tool set. This will give others the flexibility to create their own reports and become somewhat of a “self-feeder” when it comes to answering questions on performance.
It is important to come to a common set of metrics that you will collect and report on for each application. Then standardize on a common view on how you will present the real-time performance data as well as the monthly SLA reports despite the diverse technologies and different platforms each application may be running on.
Your best bet is to use five minute averages for real-time performance alerting, and percentiles for overall application profiling and Service Level Management. In other words, to make it simple: Alert on the Averages and Profile the Percentiles.
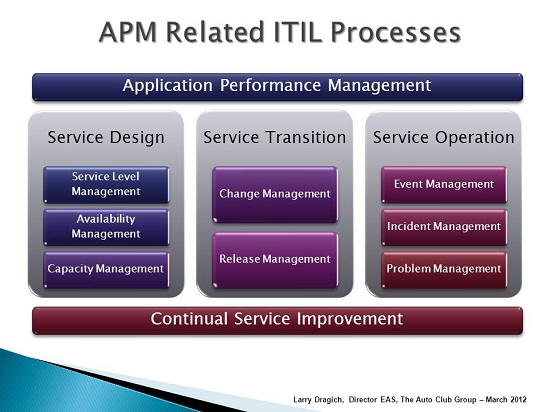
Conclusion
Overall your APM strategy will tie into multiple ITIL related processes. I look at Application Performance Management and the Continual Service Improvement model being two sides of the same coin. They both tie together service design, service transition, and service operation which in turn helps raise the bar of operational excellence for IT.
You can contact Larry on LinkedIn