In order to properly manage your applications and user experience you need to start with monitoring them. Application monitoring is evolving — from its beginnings of simply pinging a server to see if it is up, to new, more sophisticated techniques which monitor every detail of a user interaction. How do you decide what techniques to use, should you abandon old methods for new? What’s the difference between Synthetic monitoring and real application monitoring?
There are advantages and disadvantages to both and no need to pick just one. Let’s take a brief look at each technique and see why together they’re better.
There are two main techniques used to monitor applications.
Synthetic monitoring, also called directed monitoring, and Real monitoring, also called passive monitoring; with each method there can be variations in the specifics of performing the task.
What is Synthetic Monitoring?
Synthetic or directed monitoring is a method to monitor your applications by simulating users – directing the path taken through the application. This directed monitoring provides information as to the uptime and performance of your critical business transactions, and most common paths in the application.
The questions that synthetic monitoring answers include:
■ Is my site up?
■ How fast is my site?
■ Are transactions working?
■ If there is a slow down or failure where is it in the infrastructure?
■ Are my third party components operating correctly?
■ How is my overall performance?
■ Am I striking the correct balance of performance versus cost?
Synthetic monitoring does not definitively tell you what your actual users are actually experiencing. In practice that means that you can have all green lights in the data center but a user experience that is broken, slow, and impacting business. Some examples of problems that synthetic monitoring does not find include:
■ Problems with specific browsers or devices that are not included in the synthetic tests
■ Problems with a path other than the ones being tested
■ Geographical problems not specifically measured- the network between a particular location and your application server.
■ Specific individual actions taken by users such as choosing items to add to a cart, can cause problems and synthetic testing cannot cover every iteration.
■ Intermittent problems can be highly troublesome since synthetic tests may not experience the problem when they are run.
What is Real Monitoring?
Real or passive monitoring is a method to monitor your end user activity on your application. Also known as real-user measurement, real-user metrics, or end-user experience monitoring (EUM), this passive monitoring, relies on Web-monitoring services that continuously observe your system in action, tracking availability, functionality, and responsiveness.
So in contrast to synthetic monitoring, real monitoring is unscripted. Information is gathered as users use the application live so the information is only about what users are doing. When an alert is issued, then it is something that actual users experience.
Real monitoring answers these questions:
■ What are users actually doing on the site-traffic flow?
■ What is the performance of the pages, and which components are slowest?
■ Am I fulfilling SLAs?
■ Did my latest release affect the user experience?
■ How does the user experience tie back to other areas of the company such as support?
Real monitoring doesn’t tell you anything about system availability if there are no users on the system. It can’t tell you if there are any problems in the infrastructure along paths that users aren’t on.
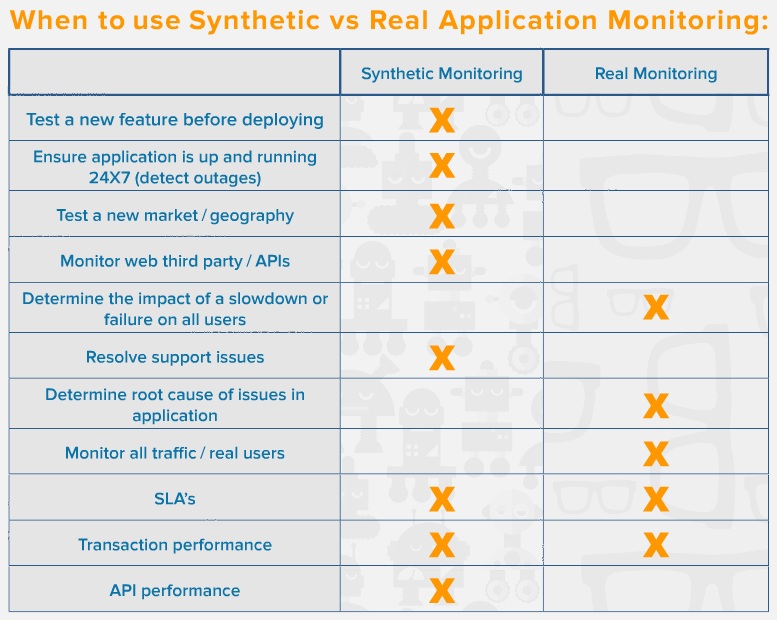
The Power of Using Synthetic and Real Together
Where real monitoring techniques provide insight into how your user actually interacts with your website or application, synthetic monitoring provides a similar assessment of expected user experience along with the benefits of true availability monitoring, third-party impact, and consistent base lining capabilities.
Combining synthetic and real monitoring gives a complete view of the user experience along with high level root cause clues. Real monitoring can miss outages, page errors, and third-party problems; while synthetic is really only a proxy for real-user experience and can miss problems experienced by various user populations. In this case, the whole really is greater than the sum of the parts. Using synthetic and real monitoring together provides a complete view of the system, infrastructure and user experience. Using both techniques in tandem eliminates those inherent blind spots and can provide an organization with the best view of their users’ experience – both actual and potential.
As important as these technical advances are, they also support organizational change creating a climate where everyone is responsible for the user experience.
■ Visibility provides efficiencies
■ Eliminates finger pointing
■ Reduces MTTR
■ Understanding impact on actual users allows for better business decisions
■ Brings business owners into the discussion
A unified system combining both synthetic and real monitoring not only facilitates these organizational changes but if it is implemented well, it provides much greater ease of use, with only one system to learn and data combined and displayed in a common manner.
This blog is an excerpt from a new interactive eBook from SmartBear, The Definitive Guide to Synthetic Vs Real Application Monitoring.
Denis Goodwin is Director of Product Management, APM, AlertSite UXM, SmartBear Software.