By embracing End-User-Experience (EUE) measurements as a key vehicle for demonstrating productivity, you build trust with your constituents in a very tangible way. The translation of IT metrics into business meaning (value) is what APM is all about.
The goal here is to simplify a complicated technology space by walking through a high-level view within each core element. I’m suggesting that the success factors in APM adoption center around the EUE and the integration touch points with the Incident Management process.
When looking at APM at 20,000 feet, four foundational elements come into view:
- Top Down Monitoring (RUM)
- Bottom Up Monitoring (Infrastructure)
- Incident Management Process (ITIL)
- Reporting (Metrics)
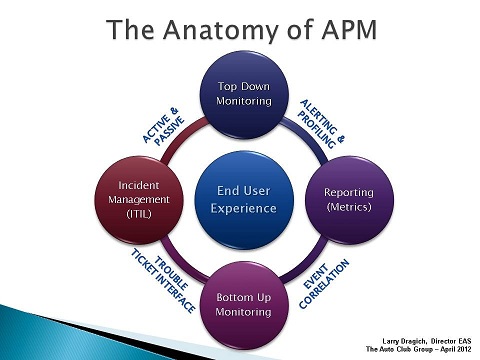
Top Down Monitoring
Top Down Monitoring is also referred to as Real-time Application Monitoring that focuses on the End-User-Experience. It has two has two components, Passive and Active. Passive monitoring is usually an agentless appliance which leverages network port mirroring. This low risk implementation provides one of the highest values within APM in terms of application visibility for the business.
Active monitoring, on the other hand, consists of synthetic probes and web robots which help report on system availability and predefined business transactions. This is a good complement when used with passive monitoring to help provide visibility on application health during off peak hours when transaction volume is low.
Bottom Up Monitoring
Bottom Up Monitoring is also referred to as Infrastructure Monitoring which usually ties into an operations manager tool and becomes the central collection point where event correlation happens. Minimally, at this level up/down monitoring should be in place for all nodes/servers within the environment. System automation is the key component to the timeliness and accuracy of incidents being created through the Trouble Ticket Interface.
Incident Management Process
The Incident Management Process as defined in ITIL is a foundational pillar to support Application Performance Management (APM). In our situation, Incident Management, Problem Management, and Change Management processes were already established in the culture for a year prior to us beginning to implement the APM strategies.
A look into ITIL's Continual Service Improvement (CSI) model and the benefits of Application Performance Management indicates they are both focused on improvement, with APM defining toolsets that tie together specific processes in Service Design, Service Transition, and Service Operation.
Reporting Metrics
Capturing the raw data for analysis is essential for an APM strategy to be successful. It is important to arrive at a common set of metrics that you will collect and then standardize on a common view on how to present the real-time performance data.
Your best bet: Alert on the Averages and Profile with Percentiles. Use 5 minute averages for real-time performance alerting, and percentiles for overall application profiling and Service Level Management.
Conclusion
As you go deeper in your exploration of APM and begin sifting through the technical dogma (e.g. transaction tagging, script injection, application profiling, stitching engines, etc.) for key decision points, take a step back and ask yourself why you're doing this in the first place: To translate IT metrics into an End-User-Experience that provides value back to the business.
If you have questions on the approach and what you should focus on first with APM, see Prioritizing Gartner's APM Model for insight on some best practices from the field.
You can contact Larry on LinkedIn
Larry Dragich of AAA Joins The BSM Blog
For a high-level view of a much broader technology space refer to slide show on BrightTALK.com which describes “The Anatomy of APM - webcast” in more context.