Network communications are a top priority for DevOps teams working in support of modern globally-distributed systems and microservices. But basic network interface statistics like received and sent traffic aren't as useful as they once were because multiple microservices may share the same network interface. For meaningful analysis, you need to dig deeper and correlate network-traffic metrics with individual processes. This is however just the beginning.
Level 1: Host-Based Monitoring

Modern performance monitoring tools provide network-related metrics by default. In addition to throughput data though, you need to know the quality of your network connections. Knowing that your host transfers a certain amount of kilobytes per second is interesting, but it's only the beginning.
For example, knowing that half of your traffic is comprised of TCP retransmissions is extremely valuable information. The amount of incoming and outgoing traffic, connectivity, and information about connection quality (i.e., number of dropped packets and retransmissions) are the metrics that serious performance monitoring tools must provide.
When compared with overall traffic patterns passing through the host NIC, such metrics can provide important insights into network quality. If there is only one service process running on a host, all the host metrics are representative of the one process. If there are several processes running, these metrics provide information about the overall availability and connection quality of all the processes.
But host-based monitoring can't show you if a process has a network problem or the amount of resources that are consumed by each process (e.g., network bandwidth). Host-based network metrics can however be good indicators that something has gone wrong in your network. The question is, who you gonna call to tell you exactly what's gone wrong?
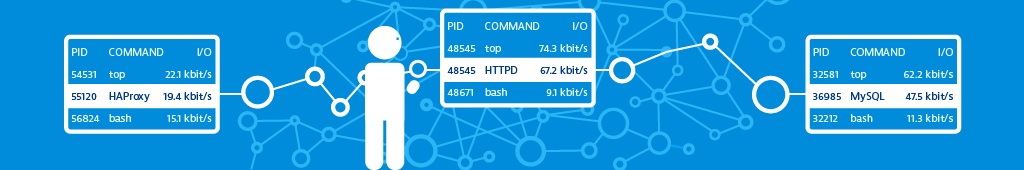
Level 2: Process-Based Monitoring

Monitoring resource consumption at the process level is a more sophisticated approach. Analyzing the throughput, connectivity, and connection quality of each process is a good starting point for productive analysis.
When monitoring at the process level you might expect to see network-volume metrics like incoming and outgoing network traffic for each process (i.e., the average rate at which data is transmitted to and from the process during a given time interval). But such volume-based metrics alone aren't sufficient for meaningful analysis because they don't tell you anything about the communication behavior of the process.
If you take the number of TCP requests into account you have a three-dimensional model of process characteristics. High network traffic and few TCP requests can indicate, for example, an FTP server providing large files. Low traffic and many requests can indicate a service that has a small data footprint (e.g., an authentication service). If you only monitor network traffic volume, you won't be able to tell the difference between an occasionally used, throttled FTP server and a frequently used web service. Clearly, the number of processed TCP requests is essential. You can use the combined network volume information to check your architectural design and expectations against empirical data and identify issues if something hasn't worked as planned, or is getting out of hand.
The rate of properly established TCP connections, both inbound and outbound, is representative of the connection availability of a process. The number of refused and timed-out TCP connections per second need to be included in an integrated view that's focused on process connectivity. With this information you can easily identify connectivity problems. Closed ports or full queues of pending connections can be the cause of connection refusals. Firewalls that don't send a TCP reject or ICMP errors and hosts that die during transmissions can be reasons for timeouts.
In addition to quantitative data, a qualitative analysis of network connections is necessary for providing a holistic view of the network properties of a process. Assessing TCP retransmissions, round-trip times, and the effective use of network bandwidth provide additional insights. Opposing host and process retransmission rates can help in identifying the source of network connection problems.
Round-trip times are an important measure, especially when clients from remote locations or hosts in different availability zones play a role. The most precise measurement is handshake round-trip time measured during TCP session establishment. With persistent connections, for example in the backend of an application infrastructure, these handshakes occur rarely. Round-trip time during data transfer isn't as accurate but it reveals fluctuations in network latency. Typically these values don't exceed a few milliseconds for hosts on the same LAN and 50-100ms for geographically close nodes from different networks.
Apart from nominal network interface speed, the actual throughput that a process can realize is interesting data. Regardless of how fast a process responds, when large quantities of data need to be transferred, the bandwidth that is available to the process is the limiting factor. Keeping in mind that the network interface of the host running the process, the local network, and the Internet are shared resources, there are dozens of things that can affect data transfer and cause fluctuations over time. Average transfer speed per client session under current network conditions is vital information.
Obviously, having all this information about the quality of your network connections is useful and can provide exceptionally deep insights. Ultimately, this information enables you to pinpoint the exact processes that are having network problems. However, one piece of the puzzle is still missing: It takes two communicating parties to produce any sort of networking problem. Wouldn't it be good to know what's going on on the remote side of the network as well?
Level 3: Communications-Based Monitoring
Although network monitoring on the process level is innovative, you need more to properly diagnose and troubleshoot problems that can occur between the components of your application infrastructure. To get the best out of network monitoring you have to monitor the volume and quality of communication between processes. Only then can you unambiguously identify process pairs that have, for example, high traffic or connectivity problems.
With this approach you can check the bandwidth usage on both ends of a communication and identify which end might be the bottleneck. You can also single out process pairs that have connectivity problems or numerous TCP retransmissions. This obviously is way faster and less error-prone than manual checks on both sides. Aside from network overlays and SDN, you can pinpoint erroneous connections down to a level where you can start doing health checks on cables and switch ports because you know exactly which components participate in the conversation.
Monitoring volume and quality of network connections on the process/communications level makes detecting and resolving issues easier, more efficient, and more comfortable.
Dirk Wallerstorfer is Ruxit Technology Lead at Dynatrace.
