
5 Steps to Enhancing Network Observability for Your NOC

Jeremy Rossbach
Broadcom

In today's fast-paced and increasingly complex network environments, Network Operations Centers (NOCs) are the backbone of ensuring continuous uptime, smooth service delivery, and rapid issue resolution. However, the challenges faced by NOC teams are only growing. In a recent study, 78% state network complexity has grown significantly over the last few years while 84% regularly learn about network issues from users. It is imperative we adopt a new approach to managing today's network experiences.

A successful network observability practice means improving operational efficiency through baby steps. There is no reason you need to boil the ocean here and rip and replace your current toolsets or processes. But the more network complexity you deal with (software-defined tech, work from anywhere, public network usage, cloud), the more you need to continually improve network operations to stay ahead of this complexity.
Image
Broadcom

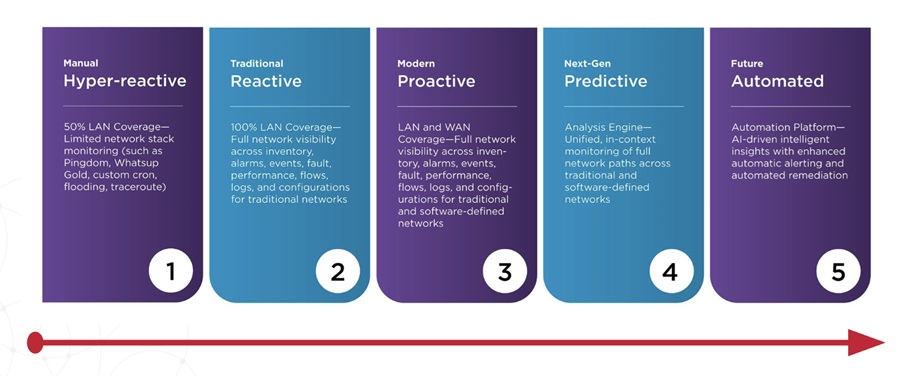
Stage 1 The Hyper-Reactive NOC

To combat swivel chair monitoring and hyper-reactive triage due to way too many monitoring toolsets, look for ways to Integrate or consolidate toolsets. 80% of orgs report a high priority to consolidate while 72% seek tight integration in their tools. Network operations with tight integration across tools have more success with NetOps.

Stage 2 The Reactive NOC

After starting the integrations or consolidations of toolsets, start expanding on the data collected and analytical features supplied by your monitoring solution to start reducing alarm noise and see the bigger picture of network device health. 57% reported they want more unified alerting (centralized alerting) while 56% say more event correlation is needed.

Stage 3 The Proactive NOC

In stage 3, network alert noise is moderate, virtual and software-defined technologies are monitored in silos by vendor-specific tools, leaving no correlation to underlay and overlay network performance. Here you should start to embrace AI-driven network observability solutions that have domain expertise in public cloud networks, WAN overlays, WAN underlays, Wi-Fi, and data center fabrics. 95% of respondents report that they don't get all of the ISP information they need to triage effectively.

Stage 4 The Predictive NOC

Here, you are doing a great job at collecting data across on-prem and public network infrastructure for end-to-end triage of network experiences, false alerts are rare and advanced analytics (AI/ML) is enabling predictive management with baselining, and anomaly detection. Consider expanding your observability into synthetics and web testing capabilities to extend visibility into public networks and an overall broader collection of data to enable proactive monitoring. Also, look to start adopting telemetry features to stream real-time events into a centralized event mgmt/analytics/reporting and automated workflows for traffic engineering, troubleshooting and network performance optimization.

Stage 5 The Automated NOC

In stage 5, you have full visibility across private and public networks to understand network performance at every hop in the end-to-end network path, advanced analytics for alarm noise reduction, configuration management and synthetic testing to evaluate the resilience of your network and public cloud and ISP networks.

Consider "low hanging fruit" network automation use cases like network configuration roll backs to known good state, enriching alarms with powerful event data or automated escalation of issues to level 2 or level 3 engineers and architects.

A mature network observability practice for your NOC  maps a progression from fragmented toolsets with limited coverage to a more integrated, platform approach with coverage for modern, hybrid networks and advanced analytics. As your network operations teams progress along this model, you can shift from reactive postures where most of their time is spent on responding to and troubleshooting alerts to a proactive posture where you are detecting and resolving problems before the business is impacted. 

Jeremy Rossbach is Chief Technical Evangelist - Network Observability at Broadcom

Hot Topics

The Latest

IT organizations have historically measured success by how quickly they can respond when something goes wrong. The entire discipline of Incident Management has been optimized around mean time to resolution, first-response SLAs and ticket closure rates. But new research suggests that even though this is a well-executed playbook, it's no longer enough to retain customers ...

Production incidents rarely announce themselves as database problems. They appear as slow transactions, timeouts, rising response times, or an application struggling under a workload it previously handled. APM provides an essential starting point. It can identify a slow transaction path, highlight an affected service, and show that a database dependency is consuming more time than expected. But identifying the database as part of the problem is not the same as explaining what is happening inside it ...

Cloud teams are under constant pressure to reduce spend without slowing development or increasing operational risk. They are deploying autoscalers, rightsizing workloads, enforcing resource requests, reviewing utilization dashboards, and building FinOps processes around cloud-native environments. Yet the results often disappoint ...

Ask most IT leaders about their biggest concern with AI and you'll hear the same answer: hallucinations ... Today, however, the conversation has shifted ... As organizations move beyond chatbots and experiments, they are increasingly deploying AI agents that perform multi-step tasks. These systems retrieve documents, query databases, call APIs, generate reports, write code, and make recommendations. The issue is not whether the model can reason. The issue is whether the organization can see, verify, and govern the decisions being made along the way ...

While organizations want to take control of their telemetry, building telemetry pipelines from scratch can be a very daunting, complicated task, even when leveraging open-source standards like OpenTelemetry. It requires specialized knowledge across distributed systems, data engineering, and security. This fragmented approach across systems causes higher operational costs; it puts a strain on resources and reduces efficiency as teams have to work with different interfaces and processes ...

For decades, enterprise networks were designed around a simple assumption: work happened inside the office. Applications lived in centralized data centers, employees connected through internal infrastructure, and security focused on protecting the perimeter that surrounded everything ... But the way organizations operate today bears little resemblance to that environment. Cloud platforms host critical applications, employees connect from homes and airports as often as they do from offices, and partners collaborate through shared systems that exist far beyond corporate walls. In short, the corporate network no longer resembles the environment it was designed to protect ...

As an analyst who researches how IT organizations design, build, and operate their networks, I find that network data is a constant source of pain. Network teams struggle with data quality, fragmentation, authority, access, and trust. And these issues undermine everything they try to do. Here are the numbers: Only 45% of network teams are completely confident in the accuracy of their network source of truth, which documents the intent of their network ...

The 2026 Global Data Center Survey from Uptime Institute reveals an industry navigating workforce constraints, escalating outage expenses, even as rising costs remain the top concern for management teams ...

The next observability gap may not be in the code. It may be under the rack. That sounds strange until you think about how AI incidents actually feel in the middle of an investigation ... The application dashboard may be accurate. It may also be stopping at the wrong boundary. AI systems depend on software, but they also depend on a dense physical stack: racks, power paths, thermal margin, maintenance activity and, in many environments, liquid cooling. Those physical dependencies can change slowly before they look like a software incident ...

Certificate expiration is the rare outage you can see coming. Every TLS certificate carries the date it stops working, so the moment it will begin breaking connections is knowable in advance. That's what makes an expired certificate such a frustrating way to lose a service. What's changing now is how often that date comes around ...

5 Steps to Enhancing Network Observability for Your NOC

Jeremy Rossbach
Broadcom

In today's fast-paced and increasingly complex network environments, Network Operations Centers (NOCs) are the backbone of ensuring continuous uptime, smooth service delivery, and rapid issue resolution. However, the challenges faced by NOC teams are only growing. In a recent study, 78% state network complexity has grown significantly over the last few years while 84% regularly learn about network issues from users. It is imperative we adopt a new approach to managing today's network experiences.

A successful network observability practice means improving operational efficiency through baby steps. There is no reason you need to boil the ocean here and rip and replace your current toolsets or processes. But the more network complexity you deal with (software-defined tech, work from anywhere, public network usage, cloud), the more you need to continually improve network operations to stay ahead of this complexity.

Image
Broadcom

Stage 1 The Hyper-Reactive NOC

To combat swivel chair monitoring and hyper-reactive triage due to way too many monitoring toolsets, look for ways to Integrate or consolidate toolsets. 80% of orgs report a high priority to consolidate while 72% seek tight integration in their tools. Network operations with tight integration across tools have more success with NetOps.

Stage 2 The Reactive NOC

After starting the integrations or consolidations of toolsets, start expanding on the data collected and analytical features supplied by your monitoring solution to start reducing alarm noise and see the bigger picture of network device health. 57% reported they want more unified alerting (centralized alerting) while 56% say more event correlation is needed.

Stage 3 The Proactive NOC

In stage 3, network alert noise is moderate, virtual and software-defined technologies are monitored in silos by vendor-specific tools, leaving no correlation to underlay and overlay network performance. Here you should start to embrace AI-driven network observability solutions that have domain expertise in public cloud networks, WAN overlays, WAN underlays, Wi-Fi, and data center fabrics. 95% of respondents report that they don't get all of the ISP information they need to triage effectively.

Stage 4 The Predictive NOC

Here, you are doing a great job at collecting data across on-prem and public network infrastructure for end-to-end triage of network experiences, false alerts are rare and advanced analytics (AI/ML) is enabling predictive management with baselining, and anomaly detection. Consider expanding your observability into synthetics and web testing capabilities to extend visibility into public networks and an overall broader collection of data to enable proactive monitoring. Also, look to start adopting telemetry features to stream real-time events into a centralized event mgmt/analytics/reporting and automated workflows for traffic engineering, troubleshooting and network performance optimization.

Stage 5 The Automated NOC

In stage 5, you have full visibility across private and public networks to understand network performance at every hop in the end-to-end network path, advanced analytics for alarm noise reduction, configuration management and synthetic testing to evaluate the resilience of your network and public cloud and ISP networks.

Consider "low hanging fruit" network automation use cases like network configuration roll backs to known good state, enriching alarms with powerful event data or automated escalation of issues to level 2 or level 3 engineers and architects.

A mature network observability practice for your NOC  maps a progression from fragmented toolsets with limited coverage to a more integrated, platform approach with coverage for modern, hybrid networks and advanced analytics. As your network operations teams progress along this model, you can shift from reactive postures where most of their time is spent on responding to and troubleshooting alerts to a proactive posture where you are detecting and resolving problems before the business is impacted. 

Jeremy Rossbach is Chief Technical Evangelist - Network Observability at Broadcom

Hot Topics

The Latest

IT organizations have historically measured success by how quickly they can respond when something goes wrong. The entire discipline of Incident Management has been optimized around mean time to resolution, first-response SLAs and ticket closure rates. But new research suggests that even though this is a well-executed playbook, it's no longer enough to retain customers ...

Production incidents rarely announce themselves as database problems. They appear as slow transactions, timeouts, rising response times, or an application struggling under a workload it previously handled. APM provides an essential starting point. It can identify a slow transaction path, highlight an affected service, and show that a database dependency is consuming more time than expected. But identifying the database as part of the problem is not the same as explaining what is happening inside it ...

Cloud teams are under constant pressure to reduce spend without slowing development or increasing operational risk. They are deploying autoscalers, rightsizing workloads, enforcing resource requests, reviewing utilization dashboards, and building FinOps processes around cloud-native environments. Yet the results often disappoint ...

Ask most IT leaders about their biggest concern with AI and you'll hear the same answer: hallucinations ... Today, however, the conversation has shifted ... As organizations move beyond chatbots and experiments, they are increasingly deploying AI agents that perform multi-step tasks. These systems retrieve documents, query databases, call APIs, generate reports, write code, and make recommendations. The issue is not whether the model can reason. The issue is whether the organization can see, verify, and govern the decisions being made along the way ...

While organizations want to take control of their telemetry, building telemetry pipelines from scratch can be a very daunting, complicated task, even when leveraging open-source standards like OpenTelemetry. It requires specialized knowledge across distributed systems, data engineering, and security. This fragmented approach across systems causes higher operational costs; it puts a strain on resources and reduces efficiency as teams have to work with different interfaces and processes ...

For decades, enterprise networks were designed around a simple assumption: work happened inside the office. Applications lived in centralized data centers, employees connected through internal infrastructure, and security focused on protecting the perimeter that surrounded everything ... But the way organizations operate today bears little resemblance to that environment. Cloud platforms host critical applications, employees connect from homes and airports as often as they do from offices, and partners collaborate through shared systems that exist far beyond corporate walls. In short, the corporate network no longer resembles the environment it was designed to protect ...

As an analyst who researches how IT organizations design, build, and operate their networks, I find that network data is a constant source of pain. Network teams struggle with data quality, fragmentation, authority, access, and trust. And these issues undermine everything they try to do. Here are the numbers: Only 45% of network teams are completely confident in the accuracy of their network source of truth, which documents the intent of their network ...

The 2026 Global Data Center Survey from Uptime Institute reveals an industry navigating workforce constraints, escalating outage expenses, even as rising costs remain the top concern for management teams ...

The next observability gap may not be in the code. It may be under the rack. That sounds strange until you think about how AI incidents actually feel in the middle of an investigation ... The application dashboard may be accurate. It may also be stopping at the wrong boundary. AI systems depend on software, but they also depend on a dense physical stack: racks, power paths, thermal margin, maintenance activity and, in many environments, liquid cooling. Those physical dependencies can change slowly before they look like a software incident ...

Certificate expiration is the rare outage you can see coming. Every TLS certificate carries the date it stops working, so the moment it will begin breaking connections is knowable in advance. That's what makes an expired certificate such a frustrating way to lose a service. What's changing now is how often that date comes around ...