As users depend more and more on your services, maintaining excellent reliability becomes more important. But how do you effectively improve the reliability of your services?
There are as many ways to improve reliability as there are causes of failure, so how do you prioritize?
And how do you know if you're succeeding?
We always say that achieving reliability that satisfies your customers is a journey, so it's natural to ask: are we there yet?
But as you progress on your reliability journey, you'll find that it isn't really about a single destination. As services change and demand grows, reliability will need to grow alongside it.
Understanding how to prioritize your reliability investments is a process we can break down into six steps:
1. Categorize areas of impact for your SRE organization
2. Ask the right questions about these areas
3. Measure the indicators that answer these questions
4. Assess the gaps between your current state and what customers need
5. Consolidate this data into a reliability dashboard
6. Understand how your changing business requirements affect your reliability needs
Let's explore each of these steps.
1. Categorize areas of impact
Reliability is the backbone of your entire service, and therefore your organization as a whole. However, we know that SREs aren't responsible for every aspect of your business (although it might seem like it!). It's important to categorize which responsibilities fall under the SRE function, and which distinct area of SRE each task falls into. This will help you determine what questions you can ask about to determine the degree of success by category.
It can be helpful to make a general list of responsibilities that could fall under SRE, and then come up with major buckets to sort them into. Here are four good categories to work with and some of the tasks that fall within them:
Incident Management
■ Runbooks
■ Incident response
■ On-call scheduling
■ Alerting
Change Management
■ Canarying releases
■ Load testing
■ CI/CD
■ Cloud infrastructure
Continuous Improvement
■ Retrospectives
■ Scalability
■ Chaos engineering
■ Resilience
Monitoring and Detection
■ Metrics
■ Observability
■ SLIs/SLOs
■ Logging
2. Ask the right questions
Once you've categorized where SRE practices will make an impact, you need to figure out what sort of impact you want to have. Think about how these categories are reflected against your business success metrics. For example, improving your incident management process will reduce downtime, leading to better customer retention. Next, come up with questions where a positive answer translates to positive business outcomes.
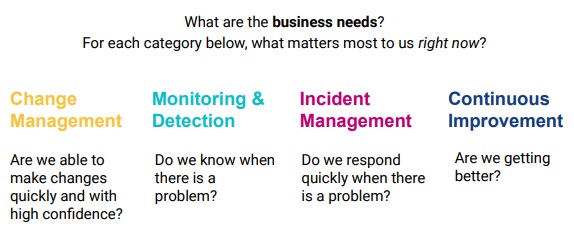
Here's an example of questions reflecting business needs for each category.
Keep in mind, though, that even though you've come up with a question that connects the category with business impact, it may not be the right question. You may discover that there's another line of questioning that better reflects business needs, or that the questions change as business needs evolve. Working out the right questions to ask is a process; the important thing is moving forward with questions, learning, and iterating.
3. Measure the right indicators
Once you've got some questions to work with, you need to figure out what metrics will answer these questions. Don't be limited to things you're already measuring – you may discover that you need to implement additional monitoring and logging to capture what you need.
Finding out about the health of your system may require more than just system monitoring, too. Here are some other factors to consider when assessing your reliability progress:
■ Product surveys and other customer feedback
■ Tickets created by customers or engineers
■ Tracking of internal processes, like change management
■ Productivity and demands on engineers
The important thing is taking a holistic view of system health, incorporating every aspect that could have a bearing on your reliability.
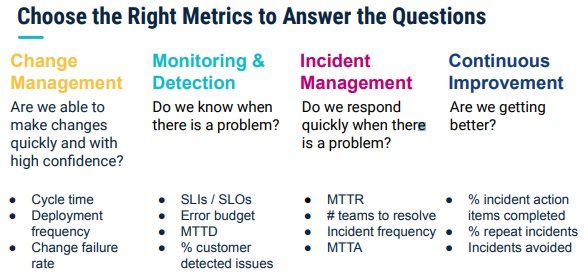
Here are some examples of metrics that would answer these questions.
4. Perform gap assessment
Now that you can measure the state of your reliability metrics currently, you need to assess how acceptable they are. Are business needs being met at the current levels?
If not, how much would they need to be improved before they become acceptable?
Calculate the percentage of the target metric you're currently at.
For example, if you want to reach less than 5 minutes of downtime for a specific service over a 30 day period, and your latest metric is 8 minutes of downtime, you can calculate the gap as follows:
(8 minutes - 5 minutes) / 8 minutes = 0.375 = 37.5%
Therefore you have a gap of 37.5% for this metric.
For each metric, you need to clearly define how the metric is calculated, the duration of time the metric is calculated over, and the target metric you'd like to hit for the duration. Think about the needs of your customers and business when determining a target to avoid overspending.
What would the metric need to be for your customers to be satisfied with their experiences?
What pace of improvement would keep your organization competitive with other offerings?
At this stage, you may run into miscommunications around what your metrics mean. A given metric, such as "Change Lead Time" can have many definitions or dimensions that could mean different things to different people. As you work out acceptable limits for each metric, make sure you rigorously define and agree on factors like the time span covered, and definitions of system health.
Categorizing and color-coding the size of your gaps will be helpful for our next step.
5. Build a central view of reliability
Now we can bring together all of this data into one centralized view, shared among all teams. This will allow you to assess the overall reliability of your services at a glance, highlighting where the most significant improvements need to be made.
The centralized view should show each of your four main buckets of reliability focus as columns. Then, under each column, have each metric with its current status, goal value, and gap. Color-code them based on the size of the gap. You can break down each metric further by showing the status for each service.
Here are examples of the sort of metrics you may want to collect in each category:
Change Management
■ Change Lead Time
■ Deployment Frequency
■ Change Failure Rate
Monitoring and Detection
■ Mean Time To Detect
■ Error Budget Usage
■ % Of Customers Reported
Incident Management
■ Mean Time To Respond
■ # of Teams Involved
■ Incident Frequency
Continuous Improvement
■ % of Follow Up Tasks Completed
■ % of Time Spent on Project Work
■ % of Repeat Incidents
With just a glance, you can look at the columns and rows to see what metrics should be prioritized for improvement, and which services are unreliable.
Building this shared central view is a great achievement. It allows your development and operations teams to easily confer on priorities. However, it's not the end of the story.
6. Update based on business needs
Ultimately, you want these metrics to meaningfully reflect the needs of the business. But as your organization grows and changes, your business needs can change as well. The questions you originally asked may not be the right questions anymore, causing your dashboard to not reflect your reliability health.
In order for your dashboard to remain useful, you'll need to have conversations across teams to uncover and validate current business needs.
Here are some examples of teams you can confer with and the related questions that may result:
■ Finance - what financial metrics are you optimizing for?
■ Product - what are the critical user paths?
■ Sales - what is the market sentiment of our product's reliability compared to competitors?
■ HR - how much do you plan to grow the team size in the next 12 months?
■ Customer success - do we have sufficient visibility into user data for upsells/renewals?
You can see how each team can contribute with business needs that have ramifications on reliability.
As your organization grows, the business needs will change and reliability priorities will change with them. In early stages, you might be focused on finding your product-market fit. In order to experiment quickly with market positioning, you may prioritize iterating and prototyping quickly. As you grow, you might focus more on reliability in user base scaling or internal processes of onboarding for team building. As a mature organization, your focus may be on making the critical user experiences as reliable as possible.
Once you understand these new priorities, you can ask different questions in our original categories. Here are our examples adapted to a startup in early stages.
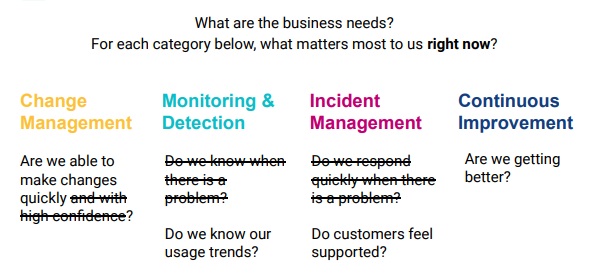
With these new questions, you can work through the same process, updating your reliability dashboard. You probably won't need to totally overhaul your whole central view, but you'll need to adapt your metrics and targets.
The journey to reliability excellence is indeed a journey. Each time you update your central view, it won't be the last. Don't be discouraged, though. With your central view, you'll know you're on the right road. As your organization grows and your priorities change, you'll likely never have everything stable and all-green. Instead, your central view is a guide to get alignment and buy-in on the top priorities for reliability.