As we enter August, back to school shopping season is in full swing. While research shows that a lot of back to school shopping still happens in brick-and-mortars, Americans are increasingly turning to their computers and mobile devices to stock up on back to school essentials.

According to the NPD Group, last year the e-commerce channel gained $90 million in dollar share growth versus brick-and-mortar, and predictions are that this year the gains could be even higher. As for mobile, new data shows that smartphone purchases for back to school have doubled.
But with this increase in mobile traffic comes a heightened expectation.
In 2014, the page load time that yielded the best conversion rate was six seconds. Now it's two. In other words, consumers will only give an online or mobile store two seconds to work — if a site or app jams or is slow, then it's hasta la vista.
The Continuing Rise of Mobile
SOASTA conducted a year over year comparison study of digital back to school traffic, discovering that in 2014, just over 60 percent of total traffic came from desktop users, while around 33 percent came from smartphones.
Just one year later, for the same set of sites, 65 percent of traffic came from smartphones, while 25 percent came from desktop. And this traffic does not solely consist of people browsing or window shopping on mobile devices only to return home and make purchases from their desktop computers. In 2014, the peak conversion rate for this set of sites was a mere 0.4 percent. Just twelve months later, the peak conversion rate for the same set of sites was over 2.2 percent — that's a change of 450 percent.
Americans Hate Delays
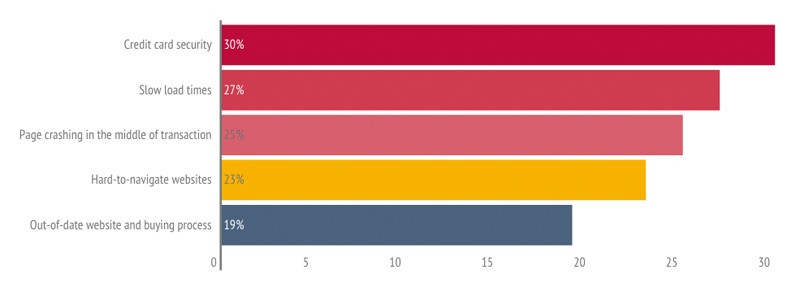
In a Harris poll of more than 2,000 Americans, 91 percent of back to school shoppers said they find making online purchases stressful, with 27 percent citing slow load times and 25 percent frustrated by pages crashing in the middle of a transaction.
If two seconds is fast, how do we define slow? SOASTA data shows that, while in 2014, conversion rates declined slowly after their peak at six seconds, in 2015, conversions take a sharper downturn. For both mobile and desktop devices, the "poverty line" — the point at which conversion rates dip down and plateau — begins at a page load time of four seconds and establishes itself at six seconds.
Retailers Have No Time to Spare
Huge improvements have been made — and continue to be made — in the mobile web and app space, both in terms of performance and user interface, and these figures illustrate that Americans are embracing the flexibility and portability of shopping from their smartphones. As Americans do more and more of their shopping from mobile devices, having a well-designed, high-functioning mobile website or mobile app is not a luxury for retailers but a mission-critical necessity.
Poor digital performance is now being measured by retailers in terms of lost customers and revenue — and the back to school shopping season, which accounts for 35 percent of the $11.8 billion in yearly sales in the US, is a true testing ground that will determine the winners and the losers in retail.
Ann Ruckstuhl is CMO of SOASTA.