In today's cloud-native world, companies are dealing with a deluge of telemetry data. But despite the concept of observability being more than six decades old, companies are still struggling to mature their observability practices. In turn, they can't tap into their data and extract insights that would otherwise help them improve performance, reliability, and cost.
According to Grafana Labs' 2024 Observability Survey, it doesn't matter what industry a company is in or the number of employees they have, the truth is: the more mature their observability practices are, the more time and money they save.
From AI to OpenTelemetry — here are four key takeaways from this year's report:
Too many tools
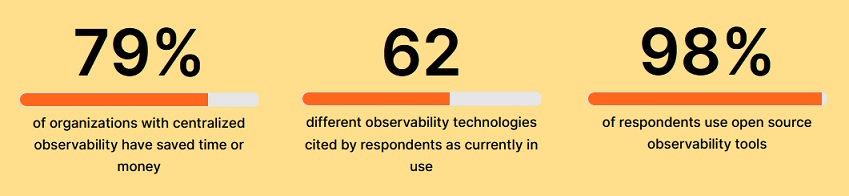
As businesses adopt new technologies and amass more data sources, they're also adding more observability tools to their toolkit to keep track of their systems. Collectively, respondents cited using 60+ technologies, and most use at least four observability tools.
But with more tools comes more complexity, which is why it's no surprise that among teams that have centralized observability, or a "single pane of glass" view of all their systems and data, 79% say it has saved them time or money as a result of lower MTTR, vendor fees, and operational costs.
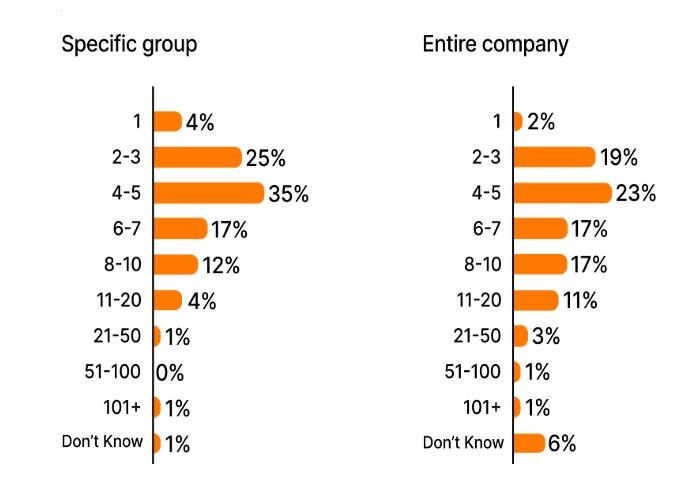
How many observability technologies are you using?
AI isn't that helpful — yet
AI is seemingly everywhere these days, but in the observability space, there's more talk about its potential than there is about actually putting it into practice. Only 7% of respondents say they're using observability on AI systems and LLMs, while 46% say it's not even on their radar.
But for those who are thinking about using AI in observability, anomaly detection is cited as the most exciting use case. Roughly half also see value in predictive insights, dashboard generation, query assistance, and automated incident summaries.
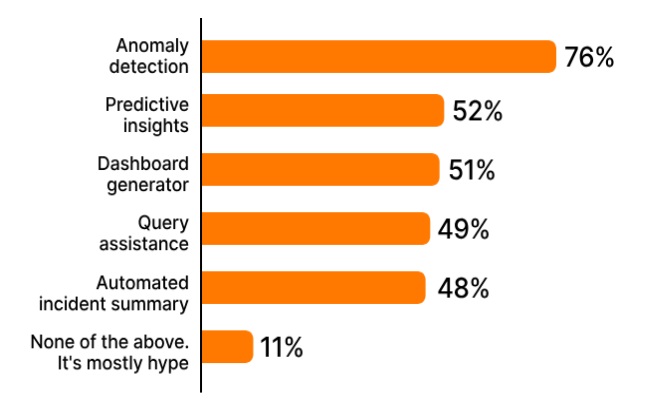
Which AI/ML-powered features would be most valuable to your observability practice?
Open source and open standards reign supreme
Open source plays an important role in the observability landscape, with 80% of the most popular technologies cited in the survey being open source. It's no surprise that OpenTelemetry and Prometheus top that list and continue to gain traction. In fact, an overwhelming majority of respondents are investing in Prometheus (89%) or OpenTelemetry (85%) — and almost 40% of respondents use both in their operations, with more than half increasing their usage of each project over the past year.
Concern over cloud costs is growing, but observability maturity can help
Respondents were asked where they land on Grafana Labs' Observability Journey Maturity Model and while a little over half say their organization has taken a proactive approach, more checked reactive than systematic. Being reactive means that more often than not, customers are raising issues before observability teams can catch them, while taking a systemic approach means developing procedures and implementing tools to find issues before users, and minimize their impact.
The different approaches can result in very different outcomes, with 65% of those with a systematic approach having saved time or money through centralized observability, compared to just 35% of those who take a reactive approach.
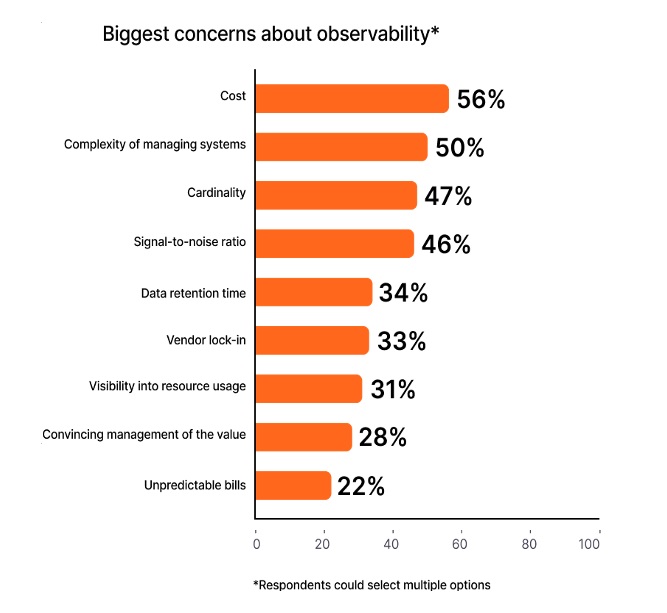
And since more than half of respondents say cost is their biggest concern, moving towards a systemic approach to observability has never been more important.
From centralizing systems and embracing open source standards to exploring new ways to use AI and fostering more proactive strategies — organizations can streamline that complexity and pave the way for enhanced operational efficiency and effectiveness.
Methodology: Grafana Labs surveyed over 300 people from all around the world for the report. Respondents hailed from companies of all sizes, from less than 10 employees to more than 5,000, and spanned across all industries, including technology, financial services, retail, healthcare, and more, providing a holistic view of the diverse landscape of observability practices and challenges across various sectors and organizational scales.