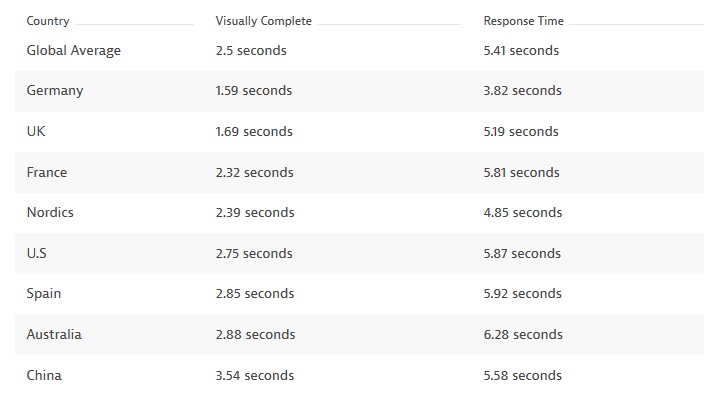
On average, global retail websites for consumers doing online shopping between Black Friday and the 3rd January were visually complete and ready to use within 2.5 seconds, according to a series of benchmark tests conducted by Dynatrace.
The tests analyzed shopper experience by measuring the time it took for leading retail sites in the UK, US, France, Germany, China, Australia, Spain and the Nordic region to be ready for shoppers to use. Shoppers in Germany and the UK could access and browse retail websites the quickest, whilst Australia and China lagged behind the rest
Retail websites in the US were 42% slower than Germany and 39% slower than the UK.
These tests measured how long it takes a web page to become "visually complete" — to appear fully loaded and ready to use from the perspective of the user. This differs from the response time metric, which measures the total time it takes for all website elements to load – including those that users can’t see and therefore don’t impact their experience.
Dave Anderson, Digital Performance Expert at Dynatrace, explains, “Whilst response time is still an important metric, it doesn’t give enough of a view on the user experience. If retailers just focus on response time metrics, they could reduce the time it takes for the full website to load, but not actually have any impact on customer experience and the time it takes for a website to be ready to use. Therefore, visually complete should be the key measure for any organization looking to truly understand online user experience.”
The test showed that the best online experience was found predominantly in western European countries. Consumers in Germany (36% faster), the UK (32% faster), France (7% faster) and the Nordic region (4% faster) all had consumer experiences that were faster than the global average of 2.5 seconds. The US (10% slower), Spain (14% slower), Australia (15% slower) and China (42% slower) came in slower that the global average.
Anderson continues, “Consumers expect websites to load within three seconds or less, so these results make for good reading for retailers. Germany and the UK are out in front when it comes to user experience, but there’s still work for retailers to do in other countries. The numbers involved may be considered fine margins, but the slightest delay in user experience can have a ripple effect on sales. For example, US-based fashion retailer Nordstrom reported an 11% fall in sales following a slowdown of just half a second.”
Methodology: Dynatrace tested the user experience of the top retail sites in eight countries every 10 minutes from November the 24th 2017 to the 3rd of January 2018. The results of this testing are outlined in the table below.