In a June 2018 survey of over 400 IT professionals within the VMware User Group community, Blue Medora took a closer look at how various metric collection strategies and access to Dimensional Data impacts IT success. We started with one question: How important is your monitoring integration strategy?
We wanted to test if increased access, data depth and context provided by a Dimensional Data stream positively impacted IT outcomes. Dimensional Data refers to a real-time metric stream provided by a monitoring integration as a service (MIaaS). A Dimensional Data stream will include highly granular behavioral detail — beyond what a single endpoint API connection might include — as well as rich relational context.
75% of Companies Lack Critical Data to Manage IT System Health and Performance
The big takeaway — many organizations are running multiple monitoring tools in an effort to get the appropriate data depth and context they need across their entire IT stack. Sixty percent of respondents are already running three or more monitoring systems and 50% of them plan to consolidate monitoring tools in the next 18 months.
But despite that, two-thirds of IT ops teams still lack visibility into the external resource relationships and three-quarters lack access to component-level data resolution, resulting in more downtime than peers using monitoring integrations that provide this critical capability.
70% of respondents said most of their monitoring integrations were not compatible with more than one monitoring platform — a leading cause of metric silos in many organizations.
Dimensional Data adoption is still in its infancy, but demand is growing. Only 9% of organizations who participated in the survey currently have access to Dimensional Data across the majority of their integrations and are considered fully deployed. On average, 43% of organizations wish to increase Dimensional Data adoption within the next 18 months.
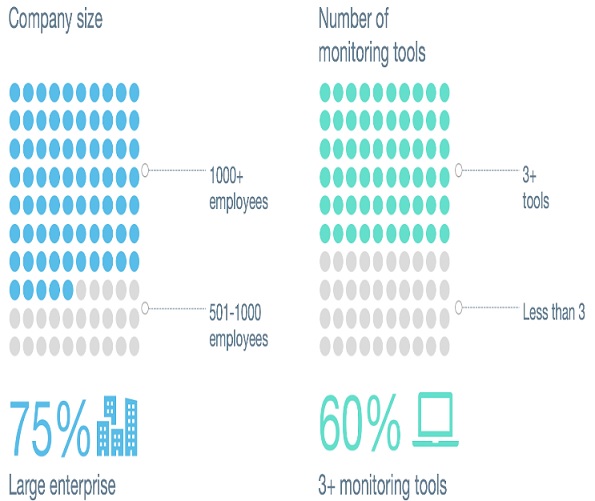
Figure 1: A breakdown of responses to the question "How many unique monitoring platforms do you have in use within your environment?"
Half of respondents indicated that they were trying to consolidate — perhaps in search of that elusive "single source of monitoring truth," but others had no near-term plans to decrease the number of monitoring tools. Some of the reasons they gave for sticking with all the tools they have included:
■ Different technologies monitored (infrastructure, cloud, etc.)
■ Different analytic or visualization capabilities
■ Different use cases (logs, performance, etc.)
■ Individual team preferences
70% of respondents said most of their monitoring integrations were not compatible with more than one monitoring platform, but demand is on the rise. Of that majority, 62% plan to make multi-platform metrics a reality in the near future.
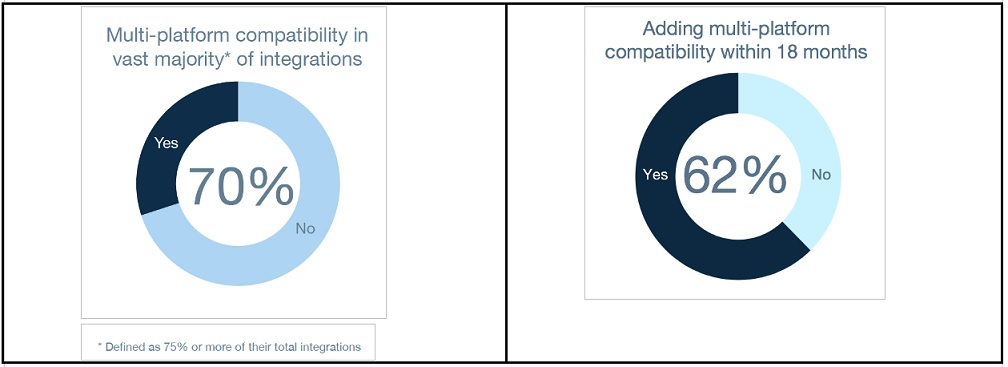
Figure 2: Respondents’ current access to metrics across multiple platforms (without customization) is currently in the minority, but could move to the majority within the next two years.
The multi-platform adoption stats are particularly interesting when taken in context with the monitoring and tool consolidation stats in key finding one. For those not interested or planning to consolidate tools (again about half of the respondents in the survey) another path to eliminating metric silos has emerged--giving all monitoring platforms universal access to the same data set.
But back to that first question — How important is your monitoring integration strategy? We were surprised how much monitoring integrations impact respondents’ business. We’d heard it in conversations over the years but had never crunched the numbers. In four out of the five areas we examined, including productivity, utilization, downtime and cost savings the answer to our question was overwhelmingly yes.
Nearly 40% of the top performers in utilization and productivity gains had fully deployed Dimensional Data.
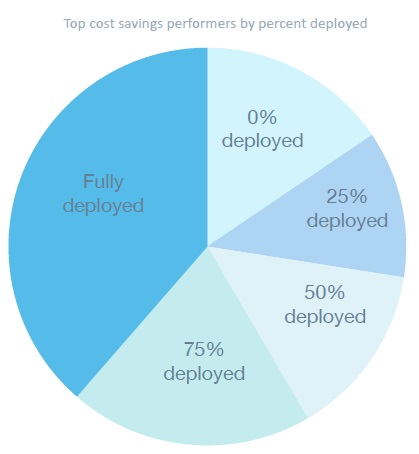
Figure 3: Of those reporting greater than $100k savings each year due to their monitoring integration strategy, 39% had fully deployed a dimensional data stream.
Of those who fully deployed Dimensional Data, one in five saw more than $1m a year in savings and one in two saw more than $100k in savings. Even we were blown away by the scale of savings.
It seems most monitoring research focuses on the efficacy of monitoring platforms or analytics engines but doesn’t spend a great deal of time looking at the data that goes into them. This research supported the idea that universal access to a Dimensional Data stream or other integration strategy that includes metric breadth, depth and context will likely have a positive context on key business measures like IT productivity, utilization, cost savings and downtime.
About the Survey: Blue Medora partnered with the VMware User Group (VMUG) to survey 410 of the group’s members about the current and near-future state of monitoring integration in their environment. All had IT responsibilities at organizations with over 500 employees. 76% of respondents held an admin or architect role within the IT organization.