Availability Probabilities
Application availability depends on the availability of other elements in a system, for example, network, server, operating system and so on, which support the application. Concentrating solely on the availability of any one block will not produce optimum availability of the application for the end user.
In the following diagram, a "linear" or "non-redundant" configuration of elements supporting the user application is shown. In vendor engineering publications, these elements are referred to as "blocks," although other publications may refer to them as "components."
It is evident that if any block in the series configuration fails, the user loses the use of the application. The application is as available as the weakest link in the chain, or so it would appear.
The following figure is a schematic showing a linear chain of blocks, henceforth known as non-redundant blocks or blocks in series. It is easy to see that the failure of any block in the chain will cause a failure of the service to the end user.
There are, of course, other blocks in the chain, such as operating system, middleware and so on (not shown here) but the principle is the same. A single component whose failure causes overall failure is called a single point of failure or SpoF.
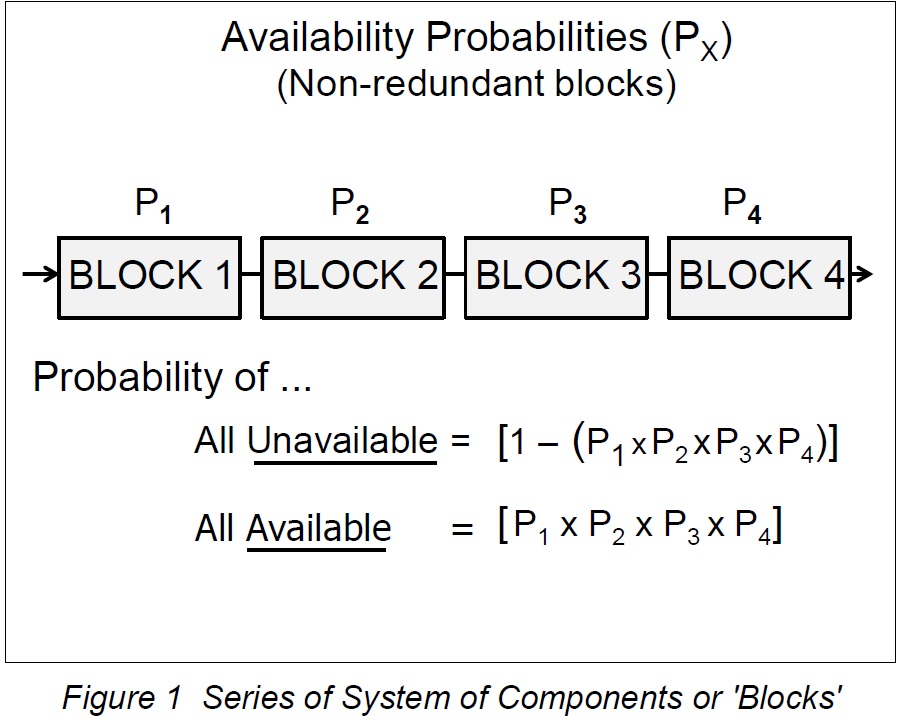
The equations above demonstrate that a series of blocks is weaker than its weakest component simply because of the multiplication of several factors, all of which are less than or equal to 1.
Lusser's Law
Lusser's Law is a prediction of reliability named after Robert Lusser (He worked on Wernher von Braun's US rocketry program post-WW2) . It states that the reliability of a series system (of our "blocks") is equal to the product of the reliability of its component subsystems, if their failure modes are known to be statistically independent. This is what we see in the above diagram. The law can be stated as follows:
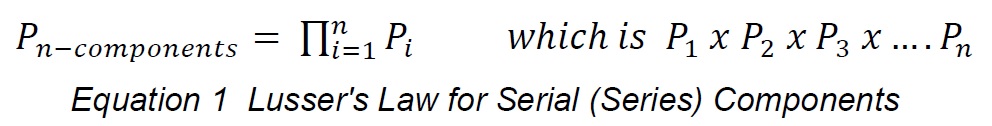
This lays to rest the theory that a chain is as strong as its weakest link, the thinking at the time. Lusser's Law deals with the reality of this situation.
Next in this document we will discuss using components in parallel and how to make the assessment of availability more IT-specific and not just deal with anonymous blocks or components which might represent anything in a reliability context - valves, pipes etc.
Part of availability management is the examination of the service failure points in the configuration between application and user, assess their impact on service availability and design round them. Obviously there are cost implications to going over the top in design, especially in the cases below.
Effect of Redundant Blocks on Availability
The discussion so far has dealt with linear chains of blocks (blocks in series, to use an electrical analogy), where the whole chain is weaker than its weakest link – Lusser's Law.
To carry this analogy further, it is possible to use blocks in parallel to increase the availability of the chain, assuming that one block can take over from a failed block, assuming that the blocks fail independently. The following diagram illustrates this for two blocks:
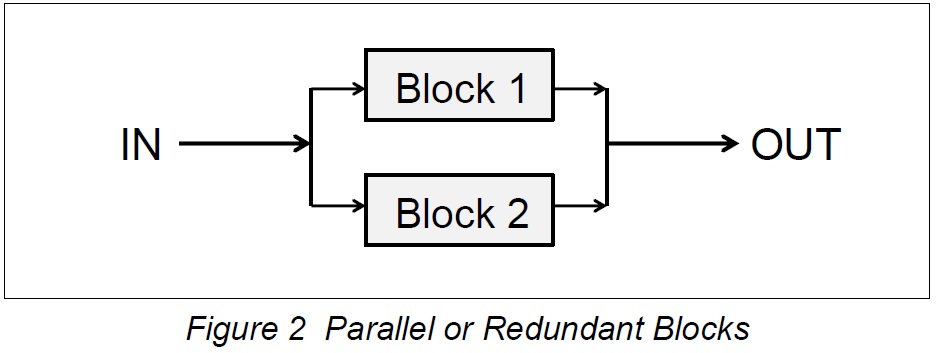
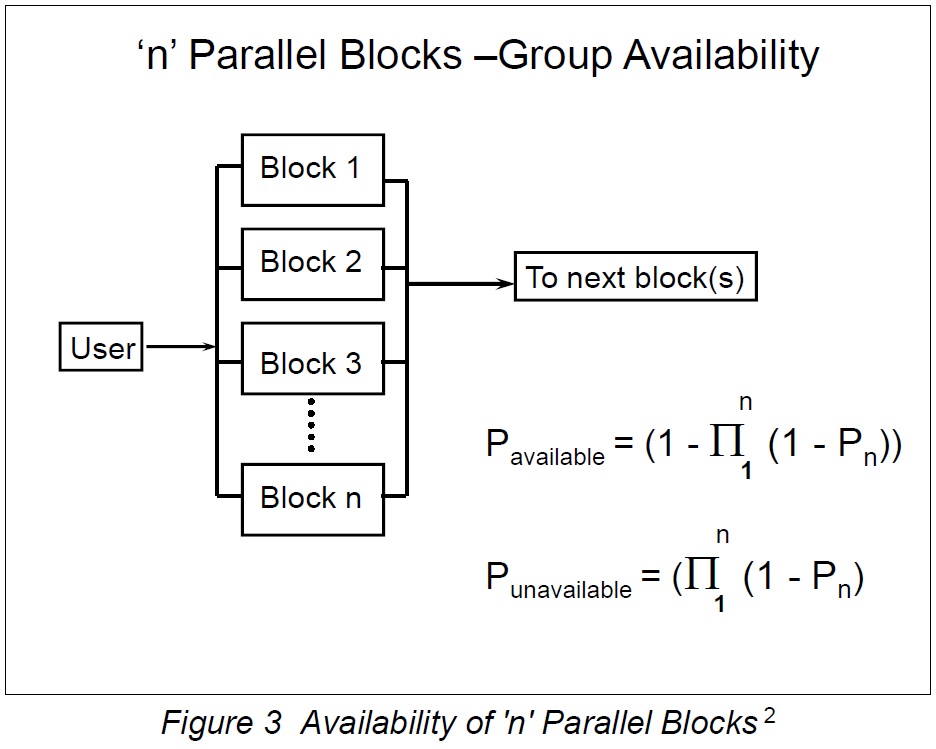
These blocks might be NICs, disks, server or other parts of a working system. The general case for 'n' parallel blocks is shown below, together with the equations for availability and non-availability probabilities.
Parallel (Redundant) Components
The next figure illustrates components configured in parallel as opposed to in series as we have seen already. The mathematics of these configurations is similar to Lusser's mathematics except we deal with 'unreliability' instead of 'reliability' entities in the math.
The basic premise in these calculations is that if the probability of being available is P, then the probability of not being available is N where;
N = (1-P) and P = (1-N)
since the total availability of being available or not available is 1. In reality, a system will consist of several sets of redundant components, for example disks, servers, network card, lines and so on. These will feed into each other, possibly mixed with single components.
The figure below shows the general case of "n" blocks in a parallel configuration. This might represent one set of components for a subsystem such as a RAID configuration or set of network interface cards (NICs). Such a configuration can be difficult to handle mathematically so a 'reduction' technique is usually employed.
Two Parallel Blocks: Example
Picture two components in parallel, one with availability probability Pa and the other Pb. The probability of both blocks being unavailable, that is, the chain is broken, is:
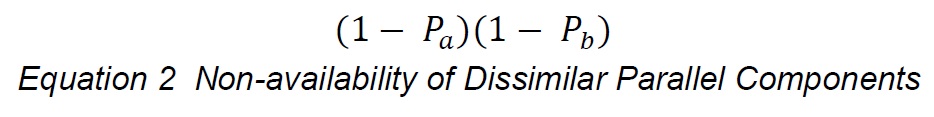
This assumes the blocks have different availability characteristics, Pa and Pb..If they were the same, say Pa = Pb = P, then the probability that both are not available is given by the relationship:
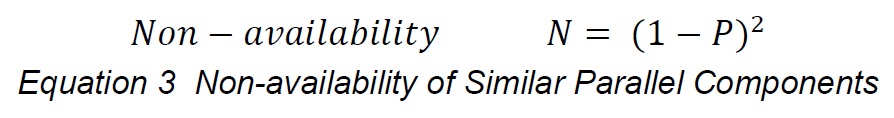
which is essentially a variation of Lusser's Law using the non-availability probabilities as multipliers instead of availability probabilities. The probability that 'n' redundant blocks are unavailable is (1 - P)n and the probability that they are all available is given by the relationship [1- (1 - P)n ]
As an example, consider two parallel blocks, each with an availability of 99.5 %. The probability that both are unavailable is:
N = (1 - 0.995) x (1 - 0.9995) = 0.000025
Hence its availability (compared with the availability of a single non-redundant case of 99.5%) is:
A(%)=(1-N) x 100=(1-0.000025) x 100%=99.999975%
The knowledge of each value of "P" and some mathematical skills would be needed to solve the problem of service availability for a combination of serial and parallel service blocks, which is often the case in real life. The book High Availability IT Services covers this latter case.