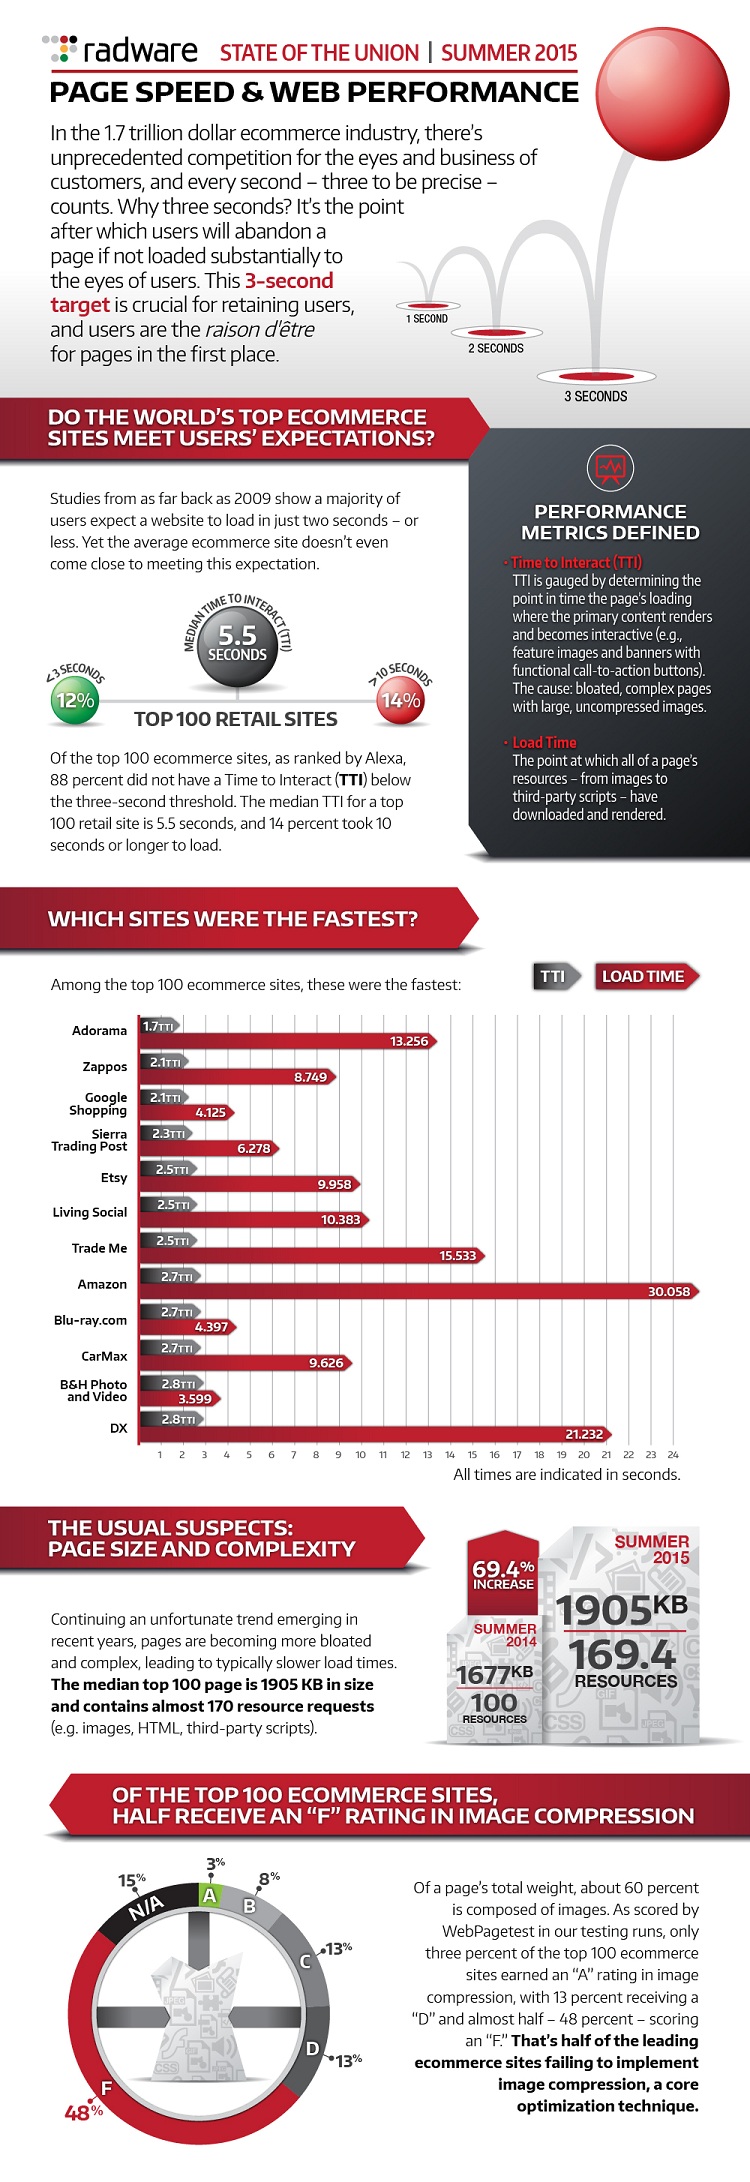
As the 2015 holiday shopping season rapidly approaches, only a few retailers – 12% of the top 100 ecommerce sites – are currently meeting customer expectations for both content and page speed, according to Radware's latest web performance report, State of the Union: Ecommerce Page Speed & Web Performance Summer 2015. It is even more surprising that 14% of top retailers take more than 10 seconds just to become functional, an increase from 9% in February 2015.
According to Statista, retail sales are estimated to exceed $1.7 trillion in 2015. Radware’s findings are a warning to the retail industry: bulky, slow web pages will fail to convert sales – even when top retailer’s sites may meet consumer demand for more content and complexity.
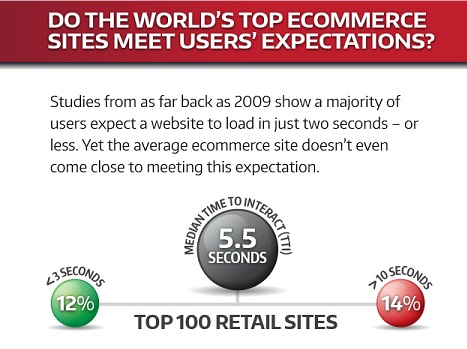
In fact, 57% of site visitors will abandon a web page after just three seconds if they are unable to interact with the key content. This Time to Interact (TTI) is critical.
“Site performance and download times are some of the most critical aspects of ecommerce that correlate to conversion rates,” said Sucharita Mulpuru, Forrester Research.
No retailer wants to abandon up to 57% of their inbound site traffic, especially during the holiday selling season. Retailers must invest in user experience for online customers, and that includes both content and page load time. Serving more content to customers is expected but the goal is delivering more content, faster. That’s the "magic formula". Web performance optimization, or lack thereof, will directly impact the bottom line for retailers this holiday season.
Today’s consumers expect more feature-rich browsing and shopping experiences that rely heavily on the increased use of high-pixel-count imagery, GIF and animated file formats, JavaScript, and app-like animations. Radware found that because of this, site owners are adding more features but they are not taking advantage of core optimization techniques. These issues result in increasing page sizes and complexity that typically contribute to slower load times.
Additional findings from the report include:
■ Page size and complexity are common contributors to slower load times, impacting the TTI. The median page is 1945 KB in size and contains 169 resource requests. The median Time to Interact is 5.5 seconds, which is considerably slower than users’ reported wait-time threshold of 3 seconds. The slowest page on the top 100 list had a TTI of 34.1 seconds.
■ Site owners have not implemented the latest core optimization techniques. Despite the fact that images comprise 50% to 60% of the average page’s total size, 48% of the top 100 sites received an “F” score from webpagetest.org for image compression.
The report also includes 14 tips to take your website from slow to "go" this holiday season, including:
■ Preload resources in the browser using an automated solution to increase load speed
■ Reformat images – avoid wasting bandwidth with unnecessarily high resolution
■ Rethink the design and location of call to action links below large feature banners
■ House heavy content below the fold to allow a faster loading experience
■ Consolidate JavaScript and CSS into common files
■ Compress text using common technologies like gzip
Kent Alstad is VP of Acceleration at Radware.
Methodology: The tests in this study were conducted using an online tool called WebPagetest – an open-source project primarily developed and supported by Google – which simulates page load times from a real user’s perspective using real browsers. Radware tested the home page of the top 100 sites from the Alexa Retail 500 three consecutive times. The system automatically clears the cache between tests. The median test result for each home page was recorded and used in our calculations. The tests were conducted on July 16, 2015, via the WebPagetest.org server in Dulles, VA, using Chrome 43 on a DSL connection. In very few cases, WebPagetest rendered a blank page or an error in which none of the page rendered. These tests were re-run with the same criteria, and flagged as such, with the results substituted in the list. To identify the Time to Interact (TTI) for each page, Radware generated a timed filmstrip view of the median page load for each site in the Alexa Retail 100. Time to Interact is defined as the moment that the featured page content and primary call-to-action button or menu is rendered in the frame.