Organizations are moving to microservices and cloud native architectures at an increasing pace. The primary incentive for these transformation projects is typically to increase the agility and velocity of software release and product innovation.
These dynamic systems, however, are far more complex to manage and monitor, and they generate far higher data volumes. According to a recent survey conducted by Forrester among infrastructure and cloud monitoring application decision makers, 88% said that they expect their data volume in the cloud to increase over the next two years, with 50% expecting it to grow significantly.
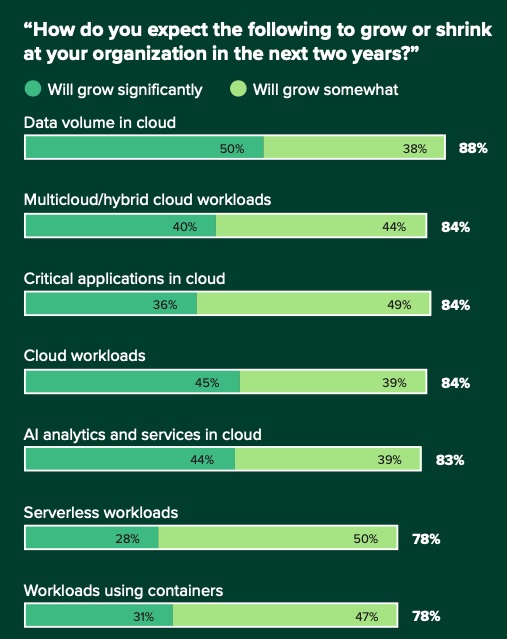
Scaling Cloud Environments Demand Efficient Observability Practices, Forrester, 2022
It’s not just about the quantity but the quality. Over half of the respondents in Forrester’s survey indicated poor data quality is a main challenge for their systems monitoring.
What is this monitoring data anyway?
The common baseline data is the "three pillars of observability", namely logs, metrics and traces. Logs and metrics have been with us in IT systems for many decades, but have experienced a surge with microservice architecture. Many flows that used to be internal within a monolith are now externalized interactions between microservices, producing corresponding logs and metrics for each such interaction and endpoint. The cardinality of the time-series metrics data is also exploding with the newly-introduced dimensions: just think about needing to slice and dice the performance of a workload per endpoint, per node, per pod, and per deployment version, to name just a few.
On top of that, distributed tracing, which used to be a niche tool, is becoming a mandatory component, in order to understand the flow of distributed requests and transactions in the system. In the recent DevOps Pulse survey issued by Logz.io, over 75% of respondents reported plans to deploy tracing in the next 1-3 years. This is not only an impressive percentage in its own right, but is also a sharp increase from the previous DevOps Pulse survey wherein only 65% responded that.
To make matters interesting, bear in mind that there are other signals beyond the traditional "three pillars," such as events and continuous profiling, which introduce additional types of data into the mix.
This data challenge isn’t a technical matter, but rather indicative of the nature of observability. As an industry we’ve been highly focused on the signal types (logs, metrics, traces) each with its own quirks, and have been growing siloed solutions for each signal type. Now it’s time to shift the focus and look at observability as a data analytics problem. Let’s start with the very definition of observability: rather than using the one borrowed from Control Theory, I favor the following definition:
"Observability is the capability to allow a human to ask and answer questions about the system."
Treating observability as a data analytics problem inevitably leads to better support in ad-hoc query capabilities, in better data enrichment and correlation capabilities, and most importantly in taking down the silos and fusing together all the data types and visualizations.
The open source community has been a key enabler for this evolution in observability. In the DevOps Pulse survey, around 40% reported that at least half of their tools are open source. This brings forth a unique opportunity for open source to enable better observability. It’s not just about the tools but, perhaps more importantly, about open standards. Cloud native systems have many moving pieces and telemetry data sources across polyglot microservices as well as multiple third party frameworks and services. This creates a significant challenge on the integration side. Almost half of the respondents in the DevOps Pulse survey indicated turning to open source observability for ease of integration. This is the place where open source shines.
Important projects under the Cloud Native Computing Foundation (CNCF), such as OpenMetrics and OpenTelemetry, offer a standard way for instrumenting applications to emit telemetry data, a standard format of exposing and transmitting the data, and a standard means for collecting that data. Unlike traditional logs, for example, which have traditionally been text based and unstructured, essentially the developer writing "notes to self" or for his teammates to decipher, the new formats are geared towards scalable machine analytics. This means well structured data, with strong typing and machine readable formats such as JSON and Protobuf.
More than three in four decision makers are increasing their use of cloud-native architectures like multi cloud workloads, serverless workloads, and workloads using containers. As the adoption grows, the data volumes and data-to-noise ratio will increase. It’s time to converge the industry around leading open standards and adopt data analytics practices for mastering that data, so that we can effectively monitor these systems.