Pages of the top 500 retail websites are not only bigger, but slower than ever and not meeting the demands of online shoppers, according to a new Radware study titled State of the Union: Ecommerce Page Speed & Web Performance, Winter 2014.
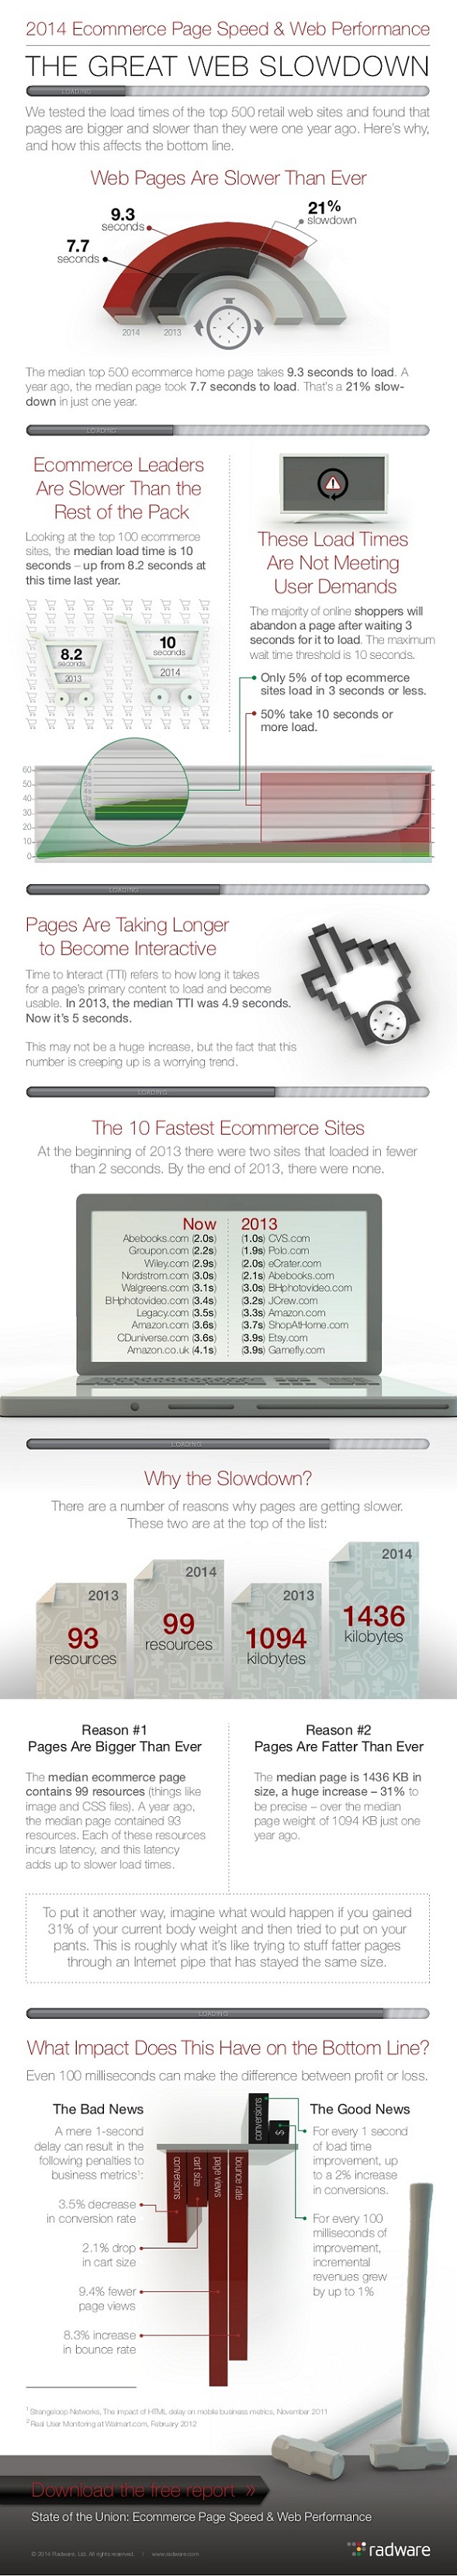
The median top 500 ecommerce home page takes 9.3 seconds to load, which is an increase of 21% in just one year, with 50% of top ecommerce sites taking 10 seconds or more to load.
The report also states that among the top 100 ecommerce sites the median load time for a page is 10 seconds, which is slightly up from 8.2 seconds last year.
Additionally, earlier established research reveals the maximum threshold that a typical Internet user is willing to wait for a page to load is 10 seconds – a startling half of the top 100 retail sites do not meet this threshold.
Jump straight to the infographic below
Key findings from Radware's latest report include:
- The median page has slowed down by 21% in just one year. The median top 500 ecommerce home page takes 9.3 seconds to load. A year ago, the median page took 7.7 seconds to load. The majority of online shoppers will abandon a page after waiting 3 seconds for it to load.
- The top 100 sites are slower than the top 500. Among the top 100 ecommerce sites, the median load time is 10 seconds – up from 8.2 seconds at this time last year. The maximum threshold that a typical internet user is willing to wait for a page to load is 10 seconds, meaning that half of the top 100 retail sites do not meet this threshold.
- Pages are taking longer to become interactive. “Time to interact” (TTI) refers to how long it takes for a page's primary content to load and become usable. In 2013, the median TTI was 4.9 seconds. Now it's 5 seconds. Some may not consider this a significant increase, but it will be interesting to see how this trend develops in the future.
- Pages are now bigger and heavier. The median ecommerce page contains 99 resources (e.g., images, CSS files, etc.). A year ago, the median page contained 93 resources. The median page is 1436 KB in size, a 31% increase over the median page weight of 1094 KB just one year ago. This growth is partially responsible for the increase in load time.
- The adoption of some core performance best practices has reached a plateau. In spring 2013, 74% of the top 100 ecommerce sites used a content delivery network (CDN): this number has grown to 80%. Keep-alives have plateaued at a 93% implementation rate. Image compression is still not widely
adopted: implementation rate continues to stand at 9%. While the adoption rate of long-standing best practices has not increased significantly, findings revealed that the use of progressive JPEGs, a practice that had fallen out of favor but is now on the upswing, has increased from 6% to 10%.
“As 2013 had its share of website outages from Amazon to Healthcare.gov, we also see that site slowdowns can also cause a negative impact on brand perception,” said Tammy Everts, web performance evangelist, Radware. “Slowdowns occur 10 times more frequently than outages, and over time, slowdowns can have double the negative financial impact as outages. This also has a major long-term impact on customer retention, as the permanent abandonment rate for a slow site is up to three times greater than the abandonment rate for a site that is down.”
Everts also added, “We're also seeing an uptick in load times as web pages are getting bigger and heavier, and at 5 seconds, the median time it takes to interact with a page does not meet consumer expectations. All of this equates to a longer wait time for the customer, who may abandon a page if it takes longer than three seconds to load.”
Methodology
The tests in this study were conducted using an online tool called WebPagetest – an open-source project primarily developed and supported by Google – which simulates page load times from a real user’s perspective using real browsers. Radware tested the home page of every site in the Alexa Retail 500 nine consecutive times. (The system clears the cache between tests.) The median test result for each home page was recorded and used in the calculations. The tests were conducted between January 16-26, 2013 via the WebPagetest.org server in Dulles, Va., using the latest version of Chrome (31.0) on a DSL connection.