

Legacy Application Performance Management (APM) vs Modern Observability - Part 3

Colin Fallwell
Sumo Logic

In Part 1 and Part 2 of this series, I introduced APM and Modern Observability, and dove into the history of the APM market. If you haven't read it, I recommend going back to the start of the series here.

The Birth and History of Modern Observability (so far)

Between 2012 to 2015 all of the hyperscalers (including Netflix, Google, AWS, LinkedIn, etc.) attempted to use the legacy APM solutions to improve their own visibility. To no avail. The problem was that none of the previous generations of APM solutions could match the scaling demand, nor could they provide interoperability due to their proprietary and exclusive agentry.

This also meant they were really unfit for keeping up with the sheer amount of innovation happening in the Cloud, due to the relatively small number of developers maintaining the agents and integration SDKs/interfaces.

To solve these shortcomings, Netflix, Google, and AWS all began working on their own projects to build telemetry pipelines, instrumentation layers, and control planes into their systems. You can see this today in numerous modern platforms, technologies, and stacks such as Kafka which was developed at LinkedIn, and Kubernetes a.k.a Borg, to orchestrate and scale workloads.

Two other Google projects, Open Census and Open Tracing, were aimed at developing the SDKs and protocols to replicate APM tracing capabilities in modern environments. There are numerous other examples. Ultimately, Google's projects succeeded in solving the scalability and interoperability limitations by developing open standards that could be implemented across any cloud. The community (and enterprises) saw the value immediately, and the projects became well-known but not widely implemented.

More recently, the CNCF merged Open Census and Open Tracing into OpenTelemetry, which is now an incubating project with massive adoption. OpenTelemetry provides a robust and highly customizable ecosystem of specifications, protocols, and libraries that results in a highly converged telemetry stream of data. What's more, it provides flexible and scalable pipelines that can be deployed at the edge via a standard set of SDKs, APIs, and protocols for discovering, instrumenting and enriching meta-data.

The best part lies in the fact it's all open-source, so if something you need is missing or broken, users are free to fork or contribute to the projects as needed.
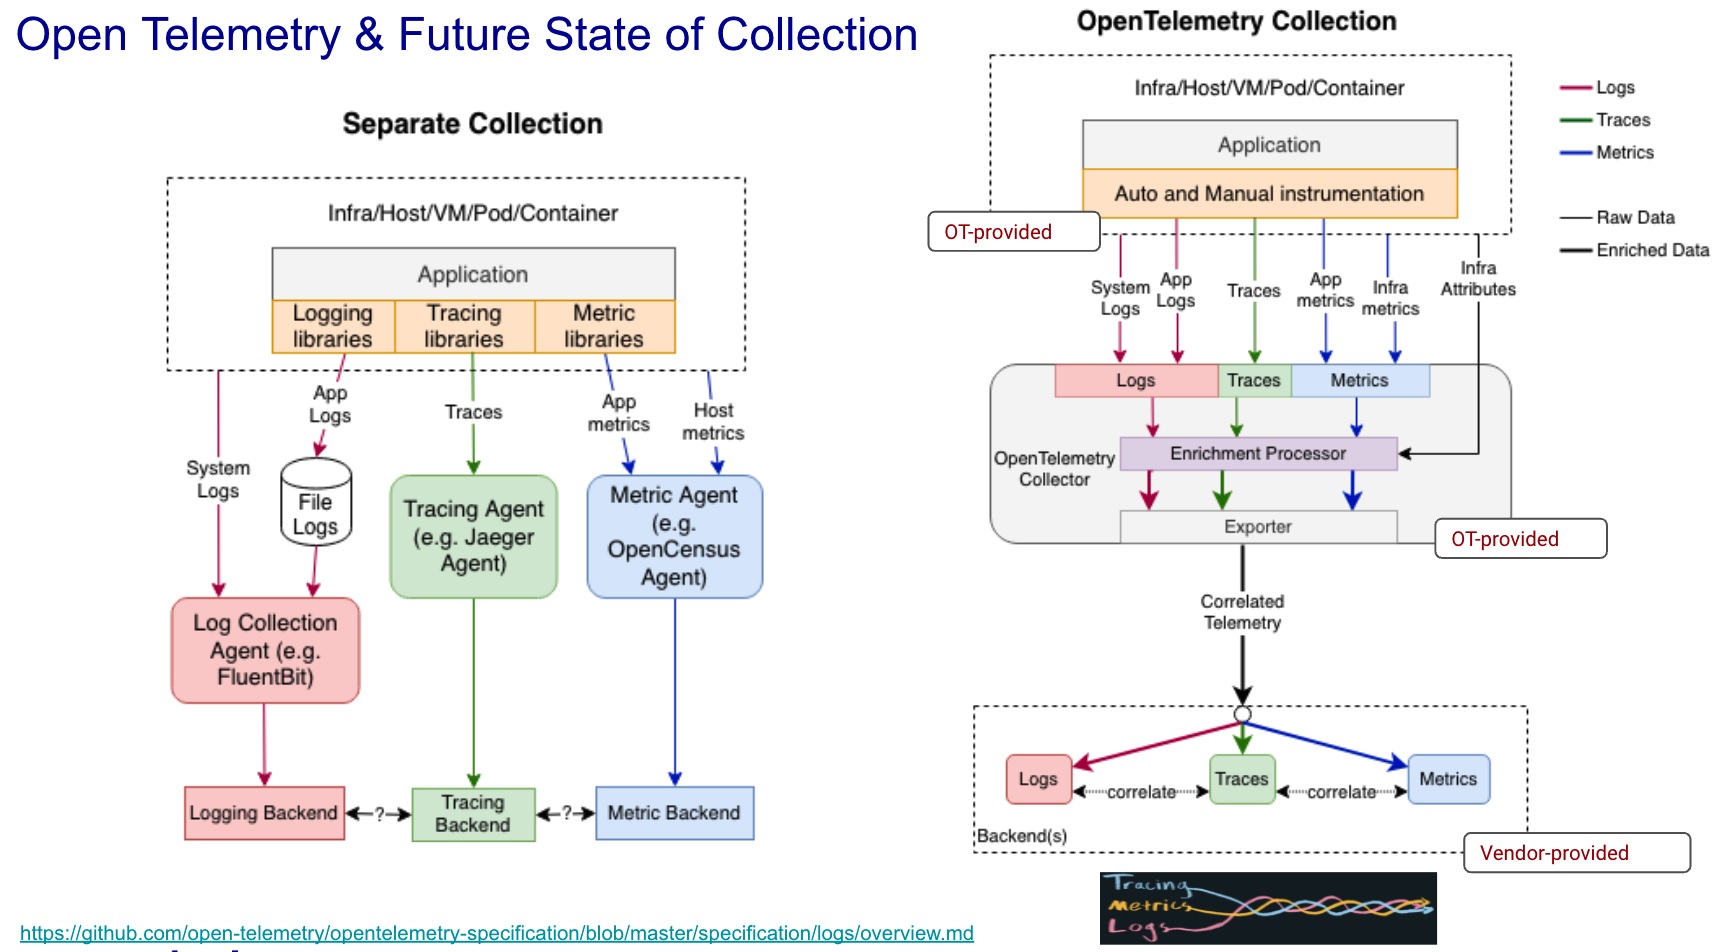

Click on image above for larger version

Modern Observability encompasses more than CNCF, open standards, protocols, and SDKs. Success with any new technology is highly dependent on the people engaging and the processes governing adoption and use. I define Modern Observability more broadly as a model or framework where all the things related to building observable systems are shifted left and declared as code.

Successful Modern Observability is led by the developer, and is defined early in the development lifecycle and continuously improved with each release. It becomes a declarative statement in the code-base deployed with the services and used as input to other GitOps models. Instrumentation is owned by developers. Developers declare in code what normal looks like providing the basis for a massive reduction in toil and churn. Observability as code enables automation in defining and deploying real-time Service Level Management (SLIs and SLOs), auto-remediation playbooks, and literally any AIOps use case.

Imagine if every service were able to reliably report the health of its internal state in real-time to the rest of the environment? How does that improve automation being orchestrated in a GitOps model and through toolchains? This is easily achievable with sound governance, frameworks, standards, and processes in place.

Giving developers the structure and tooling to declare everything as code actually matures software development teams to design not just observability telemetry but also security into the earliest phases of development, giving them a robust process to define "normal" operations "as code," along with the rules for defining Service Levels associated with the services being developed and deployed. This is really what these new ideas and methodologies such as Observability-driven development (ODD) are all about.

In the case of ODD, it provides a framework of governance and process by which developers standardize how they will build a service to be observable. It informs how they will standardize (based on each organizations' — or even each teams' — standards) the build and deploy pipelines, define what telemetry is emitted, and how they will define what normal looks like in the metrics emitted as a non-functional configuration in the codebase.

Because observability is not an afterthought in the development and deployment process, this simplifies the work developers already undertake to service the needs of business stakeholders such as customer success teams, business analysts, and the C-suite. It enables organizations to standardize how their teams digitally transform their applications, leading them to innovate faster and with observability built into everything to ensure reliability is properly measured and tracked over time.

Ultimately, for the mature developer, it creates an environment by which they are able to write services that are state-aware and can dynamically adjust to a variety of failure modes. For example, they may employ circuit-breakers to prevent already saturated downstream dependencies from compounding effects, or they may change to an alternate logic within the services in times of high latency, or dependency failure.

Closing Remarks

OpenTelemetry is increasingly the framework organizations are turning to solve their observability needs. It's now a CNCF Incubating Project and contribution and advancement in what it offers are accelerating rapidly. It provides a vendor-agnostic solution that is quickly becoming backward compatible even in monolithic on-premise environments.

Organizations adopting modern observability take ownership of the standards and practices for building observable systems. Doing so in a vendor-agnostic way means they forever own their telemetry and can continuously improve the state of observability just like they do the rest of their applications, services, and value streams. This is the bedrock upon which successful digital transformation happens. The freedom of knowing your telemetry is no longer tied to vendors ensures developers can take ownership and make technical decisions that drive successful outcomes for themselves, and the business.

As the standards and frameworks continue to mature, OpenTelemetry is poised to redefine how modern and traditional architectures are instrumented and observed. I for one firmly believe OpenTelemetry is going to be the gold standard for all telemetry acquisitions in the foreseeable future.

I truly hope you found this series informative. I also hope this gives you some ideas and strategies for improving your visibility, and innovation potential. Most of all, it's my hope that everyone can find a way to rely less on proprietary agents and more on their own resources and capabilities for building the next generation of applications and services.

Colin Fallwell is Field CTO of Sumo Logic

The Latest

In MEAN TIME TO INSIGHT Episode 24, Shamus McGillicuddy, VP of Research, Network Infrastructure and Operations, at EMA discusses network observability tool sprawl ... 

In cloud-native systems, scaling is often as simple as moving a slider. For on-premise databases, the stakes are different. Over-provisioning hardware is expensive. Under-provisioning leads to performance bottlenecks that are difficult to fix once the equipment is in the rack ...

When most people think about cybersecurity, they picture firewalls, encryption, and access controls — technical tools designed to protect systems and data. But beneath the technology lies a deeper set of principles about trust, decision-making, and resilience ... The best leaders don't eliminate risk. They manage it intelligently. And in many ways, cybersecurity offers a surprisingly useful playbook for doing exactly that ...

Many organizations assumed their infrastructure strategy was settled. It had been implemented, optimized and built into long-term plans. Recent changes in technology and vendor consolidation are forcing a second look. Cloud outages and licensing changes have exposed how much dependency exists on a small number of platforms. As a result, organizations are reevaluating whether those decisions still hold up under current conditions ...

Edge AI is strategically embedded in core IT and infrastructure spending across industries, according to the 2026 Edge AI Survey from ZEDEDA. The research shows that 83% of C-suite and IT executive respondents say edge AI is important to their core business strategy ...

As AI adoption accelerates, operational complexity — not model intelligence — is becoming the primary barrier to reliable AI at scale, according to the State of AI Engineering 2026 from Datadog ... The report highlights a compounding complexity challenge as AI systems scale ... Around 5% of AI model requests fail in production, with nearly 60% of those failures caused by capacity limits ...

For years, production operations teams have treated alert fatigue as a quality-of-life problem: something that makes on-call rotations miserable but isn't considered a direct contributor to outages. That framing doesn't capture how these systems fail, and we now have data to show why. More importantly, it's now clear alert fatigue is a symptom of a deeper issue: production systems have outgrown the current operational approaches ...

I was on a customer call last fall when an enterprise architect said something I haven't been able to shake. Her team had just spent four months trying to swap one AI vendor for another. The original plan said three weeks. "We didn't switch vendors," she told me. "We rebuilt half our integrations and discovered what we'd actually been depending on." Most enterprise leaders don't expect that to be the experience ...

Ask any senior SRE or platform engineer what keeps them up at night, and the answer probably isn't the monitoring tool — it's the data feeding it. The proliferation of APM, observability, and AIOps platforms has created a telemetry sprawl problem that most teams manage reactively rather than architect proactively. Metrics are going to one platform. Traces routed somewhere else. Logs duplicated across multiple backends because nobody wants to be caught without them when something breaks. Every redundant stream costs money ...

80% of respondents agree that the IT role is shifting from operators to orchestrators, according to the 2026 IT Trends Report: The Human Side of Autonomous IT from SolarWinds ...

Legacy Application Performance Management (APM) vs Modern Observability - Part 3

Colin Fallwell
Sumo Logic

In Part 1 and Part 2 of this series, I introduced APM and Modern Observability, and dove into the history of the APM market. If you haven't read it, I recommend going back to the start of the series here.

The Birth and History of Modern Observability (so far)

Between 2012 to 2015 all of the hyperscalers (including Netflix, Google, AWS, LinkedIn, etc.) attempted to use the legacy APM solutions to improve their own visibility. To no avail. The problem was that none of the previous generations of APM solutions could match the scaling demand, nor could they provide interoperability due to their proprietary and exclusive agentry.

This also meant they were really unfit for keeping up with the sheer amount of innovation happening in the Cloud, due to the relatively small number of developers maintaining the agents and integration SDKs/interfaces.

To solve these shortcomings, Netflix, Google, and AWS all began working on their own projects to build telemetry pipelines, instrumentation layers, and control planes into their systems. You can see this today in numerous modern platforms, technologies, and stacks such as Kafka which was developed at LinkedIn, and Kubernetes a.k.a Borg, to orchestrate and scale workloads.

Two other Google projects, Open Census and Open Tracing, were aimed at developing the SDKs and protocols to replicate APM tracing capabilities in modern environments. There are numerous other examples. Ultimately, Google's projects succeeded in solving the scalability and interoperability limitations by developing open standards that could be implemented across any cloud. The community (and enterprises) saw the value immediately, and the projects became well-known but not widely implemented.

More recently, the CNCF merged Open Census and Open Tracing into OpenTelemetry, which is now an incubating project with massive adoption. OpenTelemetry provides a robust and highly customizable ecosystem of specifications, protocols, and libraries that results in a highly converged telemetry stream of data. What's more, it provides flexible and scalable pipelines that can be deployed at the edge via a standard set of SDKs, APIs, and protocols for discovering, instrumenting and enriching meta-data.

The best part lies in the fact it's all open-source, so if something you need is missing or broken, users are free to fork or contribute to the projects as needed.


Click on image above for larger version

Modern Observability encompasses more than CNCF, open standards, protocols, and SDKs. Success with any new technology is highly dependent on the people engaging and the processes governing adoption and use. I define Modern Observability more broadly as a model or framework where all the things related to building observable systems are shifted left and declared as code.

Successful Modern Observability is led by the developer, and is defined early in the development lifecycle and continuously improved with each release. It becomes a declarative statement in the code-base deployed with the services and used as input to other GitOps models. Instrumentation is owned by developers. Developers declare in code what normal looks like providing the basis for a massive reduction in toil and churn. Observability as code enables automation in defining and deploying real-time Service Level Management (SLIs and SLOs), auto-remediation playbooks, and literally any AIOps use case.

Imagine if every service were able to reliably report the health of its internal state in real-time to the rest of the environment? How does that improve automation being orchestrated in a GitOps model and through toolchains? This is easily achievable with sound governance, frameworks, standards, and processes in place.

Giving developers the structure and tooling to declare everything as code actually matures software development teams to design not just observability telemetry but also security into the earliest phases of development, giving them a robust process to define "normal" operations "as code," along with the rules for defining Service Levels associated with the services being developed and deployed. This is really what these new ideas and methodologies such as Observability-driven development (ODD) are all about.

In the case of ODD, it provides a framework of governance and process by which developers standardize how they will build a service to be observable. It informs how they will standardize (based on each organizations' — or even each teams' — standards) the build and deploy pipelines, define what telemetry is emitted, and how they will define what normal looks like in the metrics emitted as a non-functional configuration in the codebase.

Because observability is not an afterthought in the development and deployment process, this simplifies the work developers already undertake to service the needs of business stakeholders such as customer success teams, business analysts, and the C-suite. It enables organizations to standardize how their teams digitally transform their applications, leading them to innovate faster and with observability built into everything to ensure reliability is properly measured and tracked over time.

Ultimately, for the mature developer, it creates an environment by which they are able to write services that are state-aware and can dynamically adjust to a variety of failure modes. For example, they may employ circuit-breakers to prevent already saturated downstream dependencies from compounding effects, or they may change to an alternate logic within the services in times of high latency, or dependency failure.

Closing Remarks

OpenTelemetry is increasingly the framework organizations are turning to solve their observability needs. It's now a CNCF Incubating Project and contribution and advancement in what it offers are accelerating rapidly. It provides a vendor-agnostic solution that is quickly becoming backward compatible even in monolithic on-premise environments.

Organizations adopting modern observability take ownership of the standards and practices for building observable systems. Doing so in a vendor-agnostic way means they forever own their telemetry and can continuously improve the state of observability just like they do the rest of their applications, services, and value streams. This is the bedrock upon which successful digital transformation happens. The freedom of knowing your telemetry is no longer tied to vendors ensures developers can take ownership and make technical decisions that drive successful outcomes for themselves, and the business.

As the standards and frameworks continue to mature, OpenTelemetry is poised to redefine how modern and traditional architectures are instrumented and observed. I for one firmly believe OpenTelemetry is going to be the gold standard for all telemetry acquisitions in the foreseeable future.

I truly hope you found this series informative. I also hope this gives you some ideas and strategies for improving your visibility, and innovation potential. Most of all, it's my hope that everyone can find a way to rely less on proprietary agents and more on their own resources and capabilities for building the next generation of applications and services.

Colin Fallwell is Field CTO of Sumo Logic

The Latest

In MEAN TIME TO INSIGHT Episode 24, Shamus McGillicuddy, VP of Research, Network Infrastructure and Operations, at EMA discusses network observability tool sprawl ... 

In cloud-native systems, scaling is often as simple as moving a slider. For on-premise databases, the stakes are different. Over-provisioning hardware is expensive. Under-provisioning leads to performance bottlenecks that are difficult to fix once the equipment is in the rack ...

When most people think about cybersecurity, they picture firewalls, encryption, and access controls — technical tools designed to protect systems and data. But beneath the technology lies a deeper set of principles about trust, decision-making, and resilience ... The best leaders don't eliminate risk. They manage it intelligently. And in many ways, cybersecurity offers a surprisingly useful playbook for doing exactly that ...

Many organizations assumed their infrastructure strategy was settled. It had been implemented, optimized and built into long-term plans. Recent changes in technology and vendor consolidation are forcing a second look. Cloud outages and licensing changes have exposed how much dependency exists on a small number of platforms. As a result, organizations are reevaluating whether those decisions still hold up under current conditions ...

Edge AI is strategically embedded in core IT and infrastructure spending across industries, according to the 2026 Edge AI Survey from ZEDEDA. The research shows that 83% of C-suite and IT executive respondents say edge AI is important to their core business strategy ...

As AI adoption accelerates, operational complexity — not model intelligence — is becoming the primary barrier to reliable AI at scale, according to the State of AI Engineering 2026 from Datadog ... The report highlights a compounding complexity challenge as AI systems scale ... Around 5% of AI model requests fail in production, with nearly 60% of those failures caused by capacity limits ...

For years, production operations teams have treated alert fatigue as a quality-of-life problem: something that makes on-call rotations miserable but isn't considered a direct contributor to outages. That framing doesn't capture how these systems fail, and we now have data to show why. More importantly, it's now clear alert fatigue is a symptom of a deeper issue: production systems have outgrown the current operational approaches ...

I was on a customer call last fall when an enterprise architect said something I haven't been able to shake. Her team had just spent four months trying to swap one AI vendor for another. The original plan said three weeks. "We didn't switch vendors," she told me. "We rebuilt half our integrations and discovered what we'd actually been depending on." Most enterprise leaders don't expect that to be the experience ...

Ask any senior SRE or platform engineer what keeps them up at night, and the answer probably isn't the monitoring tool — it's the data feeding it. The proliferation of APM, observability, and AIOps platforms has created a telemetry sprawl problem that most teams manage reactively rather than architect proactively. Metrics are going to one platform. Traces routed somewhere else. Logs duplicated across multiple backends because nobody wants to be caught without them when something breaks. Every redundant stream costs money ...

80% of respondents agree that the IT role is shifting from operators to orchestrators, according to the 2026 IT Trends Report: The Human Side of Autonomous IT from SolarWinds ...