Start with 3 Key Metrics for Successful Web Application Performance - NBA Edition Part 1
Start with 3 Key Metrics for Successful Web Application Performance - NBA Edition Part 2
In Part 2 of this 3-part blog series, I talked about the second metric to look at when performing a study of your website or web application, like I'm doing with the Knicks website. In this final blog of the series, I finish up with the most important metric of all – the one visitors care about – response time.
Metric #3: Response Time
Response time is the time that it takes for a request to be executed from the client application, across the network, processed by the server, and a response is returned. This time is typically measured in the number of seconds that a request takes.
If your site's response time is in the milliseconds, you're likely doing pretty great! Congratulations!
Or, you must be testing from a local environment – which you must always be careful with when it comes to web applications.
But for me, I didn't get milliseconds when I tested the Knicks site. With a FIOS connection, it took the site about 7.7 seconds to be fully loaded by the WebPageTest machine's Chrome browser.
The great thing with WebPageTest is that I can get more detail about this 7.7 seconds.
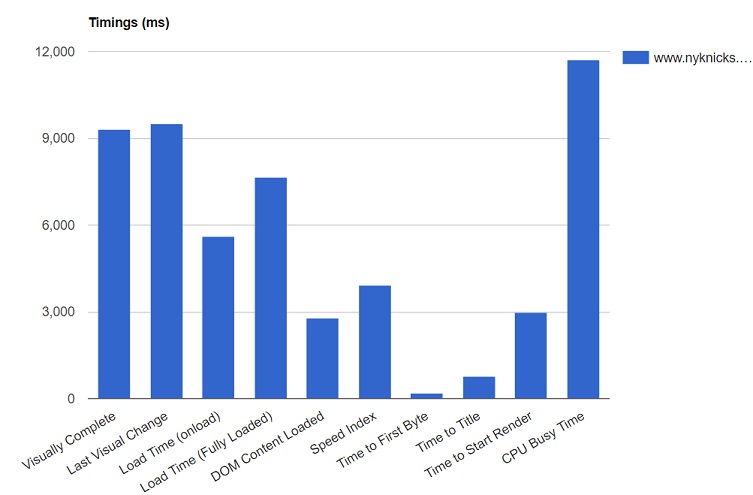
I can see that while it took my request to nyknicks.com about 7.7 seconds to fully load, it takes over 9 seconds for it to become visually complete. It also takes the site about 3 seconds before I can start to see anything being rendered in the browser.
So what's behind all these different response times? When it comes to web performance, response time is usually broken up into three parts - client response time, network response time, and server response time.
Let's discuss client response time.
Client Response Time
The client is the one making the requests to fulfill whatever it is the user is looking to accomplish. In my case, the client is the Chrome browser that I selected in WebPageTest.
However, when the user makes a request, there may be a number of things the client needs to do in order to process that request.
For example, when a user clicks on a link that is to present to them some text, the client must process the text to display it on the screen. It must be able to determine whether the text that was received is actually readable text that can be rendered in the browser.
It must also process any image received from the server.
For one, if the image is compressed, the client must run its compression algorithm to decompress this image and return it to its original size. Then, once the image has been decompressed, it must be rendered.
So the client must be able to determine what kind of image it is and then display this onto the screen.
All of this takes time for the client to process, and is very dependent on the hardware and software resources available to be able to process this as fast as possible.
So that is the client response time.
How to Get Client Response Time from WebPageTest: WebPageTest doesn't give the client response time breakdown directly. It does, however, provide a graph of the CPU processing occurring on the test machine.

With this information, you can see how certain requests are causing additional processing time on the client. This helps identify which requests you need to tweak to reduce this response time.
Now let's talk about server response time.
Server Response Time
Keeping with the example above, when the server gets a request from the client, it must figure out how to fulfill this request. The time that it takes to do this is the server response time.
Just like the client, the server is processing the request sent by the user through the client. It must look for the location of the text information that was requested. It must also locate the file containing the image that was asked for.
On the Knicks website, the client asks for a lot of images, so the server needs to locate these images and send them to the browser. Once they are found – which takes time to process – the server sends the response back to the client for display to the user. If the server has to get this information from a database, it must now take the time to convert that request to an appropriate SQL query to pull the data out of the database. Then it must wait for the database server to return a response to its request. From the standpoint of the client, all of this processing time is the server's response time.
The more hardware and software resources the server has available, the faster it can process these requests, and therefore, reduce its response time.
Don't Forget the Tiers ...
But, if it's waiting for the database server – or some other server – to return a response for its request before it can fulfill the client's request, the server is now relying on the database's response time as well.
If the two servers are close in distance to each other or are on the same machine, this time is likely to be largely made up of processing time. But if they're not close, this processing time will also include the time it takes for the request to travel the distance between the two servers.
How to Get Server Response Time from WebPageTest: I can't directly get server response time from WebPageTest, but I can use the First Byte Time that is provided to help give me a sense of any server-related issues that may need to be further investigated. First Byte Time is the time that it takes the client to receive the first byte of a response to its request to the server. So if there are any requests with high First Byte Time response times, this is something to look into as a potential server concern.
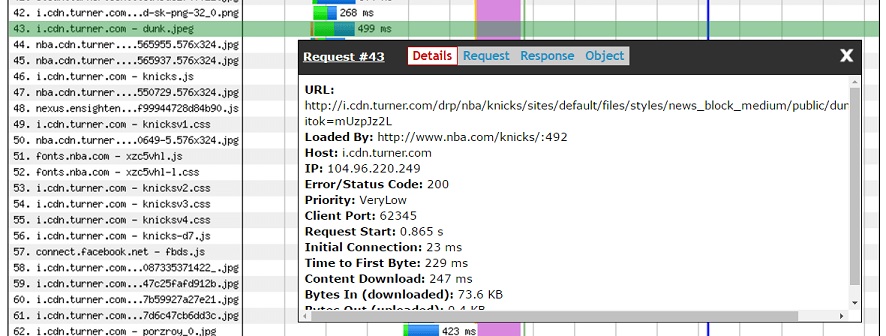
In my test of the Knicks site, I can see that an image of the Knicks Kristaps Porzingis dunking the basketball had a 229ms First Byte Time.
Given that the image was not compressed, why would it take that long for it to be processed?
And if the web application and database servers are not close in distance, not only are you looking at the processing on the server, you should also be looking at the connectivity between the application and database servers.
Maybe that's what happening on the back-end of the Knicks site.
This leads to the third piece of response time – network response time.
Network Response Time
When the client sends its request over to the server and waits for the response, the biggest portion of overall response time is usually most impacted by the distance between the two. This distance is composed of the network and all of its parts. Ideally, you want the distance between the client and server to be as close as can be, but in this global world of commerce, that's not always possible. With content delivery network providers, like Akamai, Amazon Cloudfront, and others, clients and servers can be closer than before. But there still is a distance, and you must account for that.
Main Parts of Network Time
There are four main parts to network response time.
You have processing – just like on the client and server. This is the time it takes for any device along the network path to process the data that it receives to determine where this data is going and how to get it to its next stop and ultimately to its destination.
You have queuing. This is the time that the data sent is waiting in a device's queue along the path between the client and the server before it can be transmitted.
You have serialization. This is the time that it takes to put the bits of data onto the network connections along the path that the data must traverse.
And finally, you have propagation. This is the time that it takes the bits of data sent to travel from one side to the other side.
What Can Be Improved
Serialization is the component of response time that can be improved by increasing available bandwidth.
I mentioned that I used a FIOS connection in WebPageTest that makes 20Mbps available. I also ran a separate test with a slower speed using DSL, to resemble my ISP connection.


With the FIOS connection, I only get to peak available bandwidth use a couple times or so during the test.
But with DSL, I am consistently reaching the peak bandwidth throughout the test. This is partly why the fully loaded response time for the DSL connection was over 51 seconds, compared to the 7.7 seconds on the FIOS connection!
Generally, all of the parts of network response time can be changed with better technology. You can increase the bandwidth to improve serialization, you can add more memory to improve queuing, or you can increase CPU to improve processing.
But there's little you can do to improve propagation time. This time can only be manipulated by adding a CDN or implementing WAN optimization, but not necessarily changed because the distance between client and server is still the same. If the CDN, for example, doesn't have something cached and available to send to the client, it must go all the way back to the server to get it.
Physics strikes again!
All In Together Now!
All of these components of response time affect how a user will perceive how fast your website or web application is. Higher times from either of those components obviously means high response times. And that could mean "goodbye, visitor and potential customer."
As for me and the Knicks, it's not quite "goodbye." It's more like "see you later."
If the performance of the team or its website was a true indication of fandom, I'd be following another team a long time ago. But it's not.
Are all your website's visitors fanatics? Probably not!
And That's the Bottom Line
So there it is! The three web performance metrics that you should look at when investigating or planning for performance issues with your websites and web applications.
Don't forget – The keys to successful web application performance are to find ways to reduce your response time and all of its components, minimize the number of requests the client sends, and limit the amount of data going to the client.
Your users, customers, and visitors expect fast performing web experiences. And unless they're a true, true fan of the Knicks, like I am, you'll probably lose them if you don't follow these keys.
Don't lose them! I think the Knicks have done enough losing for all of us in the last few years.
There's always high hopes at the beginning of each season for my Knicks – like I have now. There might not be for your web application.
Now I have a question for you: What do you focus on to ensure good web performance for you sites and applications?